
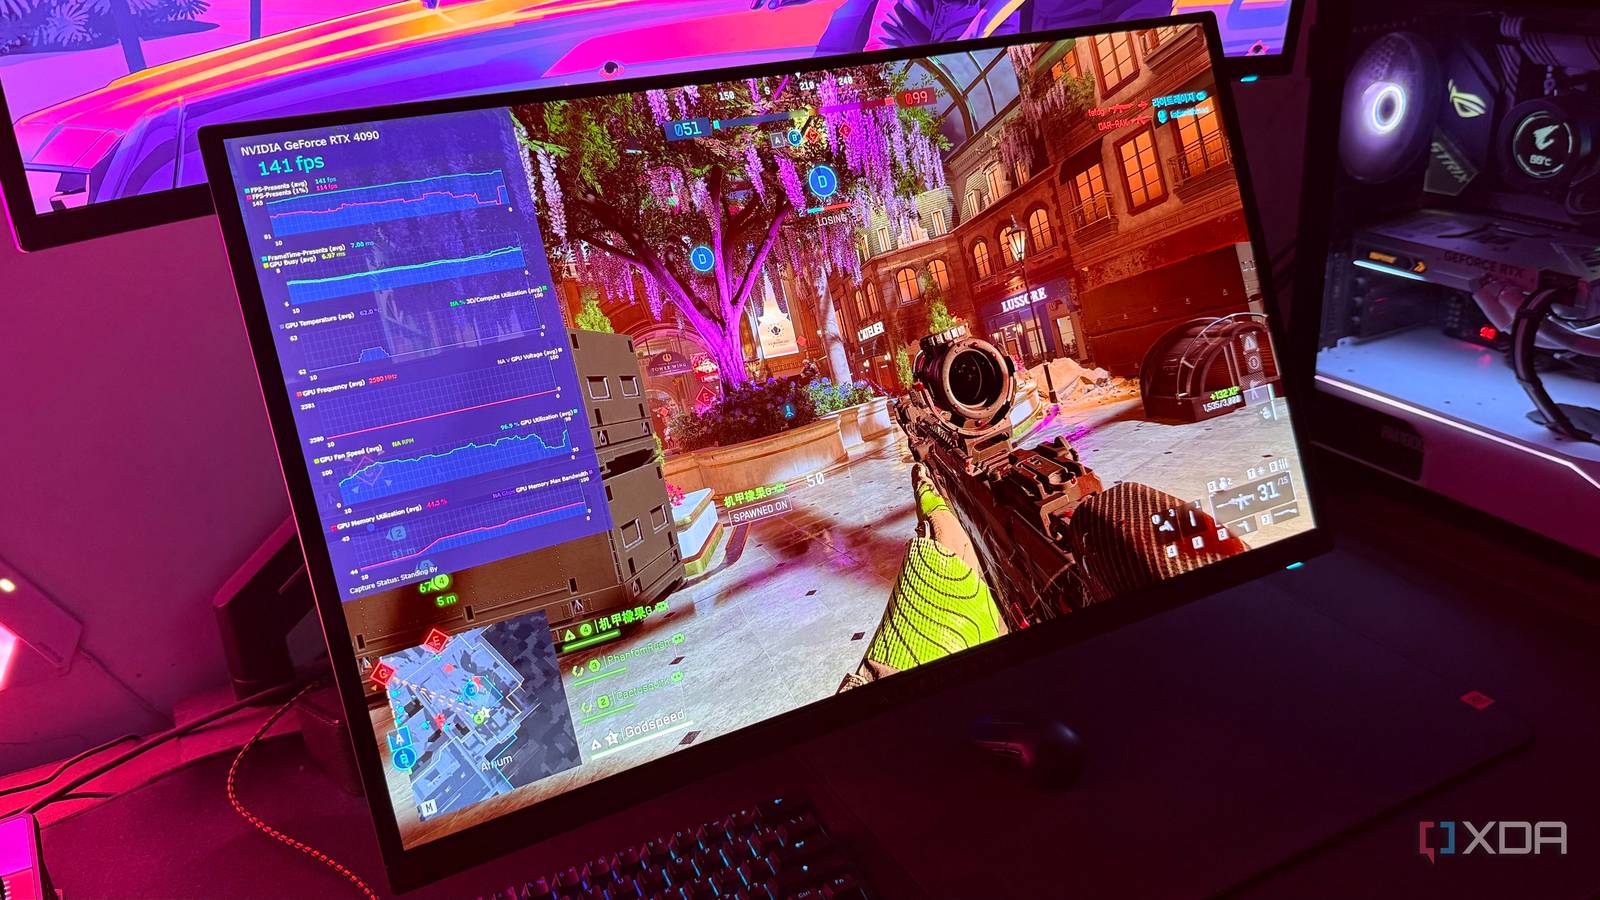
Published Nov 12, 2026, 5:30 PM EST Hamlin has been in the tech field for over nine years. Since 2017, his work has appeared on MakeUseOf, Android Police, OSXDaily, Beebom, and more. He served as the Senior Editor at Valnet's MakeUseOf for over two years before joining XDA. He uses a high-end gaming rig for desktop use and a MacBook for traveling, but dislikes some of the quirks of macOS. You're more likely to catch him at the gym or on a flight than anywhere else. At this point, MSI Afterburner needs no introduction, especially if you're a PC gamer. Its overlay is something we've all seen and grown up with, thanks to the countless PC gaming benchmarks we've watched on YouTube. In fact, whenever I start playing a new game, the first thing I do is open MSI Afterburner (and RTSS) so I can see how well it runs. And it's not just about how many frames my RTX 4090 can push either. I just like knowing how hot my components get and whether there are any bottlenecks I need to worry about. MSI Afterburner has allowed me to monitor so many metrics, from GPU usage and 0.1% lows to frame times, that I haven't felt the need to use any other monitoring tool in all my years of PC gaming. I do open HWiNFO64 every now and then, but that's mostly when I want to dig deeper into temperatures and get other hardware readings. When I came across Intel PresentMon recently, however, one of its metrics made me realize I'd been relying a little too much on GPU usage to identify bottlenecks this whole time. GPU usage wasn't telling me enough That percentage isn't a per-frame reading For the longest time, I've relied on GPU usage to figure out whether my GPU is being pushed to its limit. If I saw my RTX 4090 sitting close to 99% usage, I'd assume I was GPU-bound and there wasn't much room for improvement unless I lowered my graphics settings. And to be fair, that's a reasonable assumption. But after using PresentMon and learning about the GPU Busy metric, GPU usage feels almost like surface-level information to me. It all comes down to how GPU usage is measured. You see, that percentage only tells you how busy your GPU is over a sampling period. PresentMon's GPU Busy metric, on the other hand, measures how long your GPU spends working on each frame, in milliseconds. Now, you might be wondering what the point of knowing that number is. On its own, I wouldn't say it's necessarily more useful than GPU usage. However, when you compare GPU Busy against frame time using PresentMon's graphs, that number becomes so much more valuable for identifying bottlenecks. GPU Busy makes it easier to identify bottlenecks It's all about the gap between GPU Busy and frame time As you probably already know, frame time measures how long it takes for your PC to render each frame. So, if you're gaming at 100FPS, your frame time is going to be 10ms. Of course, your frame time won't remain constant since FPS fluctuates, but you get the point. Now, if GPU Busy stays pretty close to your frame time, that means your GPU is spending most of the frame interval rendering. So, if GPU Busy shows 9.5ms when your frame time is 10ms, you're likely GPU-bound, much like when GPU usage is pinned at 99%. On the flip side, if GPU Busy is only 6ms, that means your GPU could be waiting on some other component to catch up. Don't be quick to assume your CPU is taking up the remaining 4ms, though, because CPU and GPU workloads can overlap. To know how long your CPU spends working on each frame, you can create a custom preset in PresentMon and add CPU Busy right below GPU Busy on the same frame time graph. This way, you can monitor all three of them and get a much better idea of what's holding performance back. I'm not replacing Afterburner with PresentMon But PresentMon is still worth keeping for this one metric alone As much as I like what PresentMon brings to the table, I don't see myself ditching MSI Afterburner anytime soon. I've used it for well over a decade, and I've got my overlay configured exactly how I like it at this point. It shows way more stats on my screen without taking up too much space. And let's not forget it isn't just a monitoring tool. I've actually created a custom undervolt profile for my RTX 4090 that I load every time I launch the tool. I sometimes use it to lower the power limit and configure a custom fan curve, too. That said, I don't think I need to choose between the two. I'll continue to launch MSI Afterburner as usual because, for the most part, I don't really want anything beyond surface-level information. But when something looks off, which is usually the case when GPU usage is low, that's when PresentMon is invaluable. I can compare GPU Busy and CPU Busy against frame time to more accurately identify the bottleneck once I've ruled out other factors like an FPS cap and V-Sync. Tell XDB what you want the PC to do and how much you want to spend. We'll find parts that fit, with current prices. What will you use it for? Pick any Games or apps Optional Budget Sometimes, graphs tell you more than numbers I absolutely love how PresentMon lets me visualize GPU Busy, CPU Busy, and frame time on the same graph instead of just giving me numbers and leaving me to figure out what they mean. It's one thing to see your GPU usage sitting at 80% and wonder why it isn't being pushed harder, but it's another to actually see how much time your GPU spends rendering each frame. PresentMon has made me realize there's more to identifying bottlenecks than a few percentages. GPU usage is still relevant to me when monitoring performance, but it's no longer the be-all end-all it used to be. Now, it's more of a starting point, with GPU Busy being the metric I turn to for the specifics. Intel PresentMon PresentMon is an open-source monitoring tool developed by Intel that helps you identify CPU and GPU bottlenecks by comparing GPU Busy with frame times.
I've used MSI Afterburner for years, but Intel PresentMon showed me what I was missing
Full Article
Original Source
Read the full article at Xda-developers →KhanList aggregates and links to publicly available news content. We do not host full articles from third-party sources. Always verify important information with original sources.