
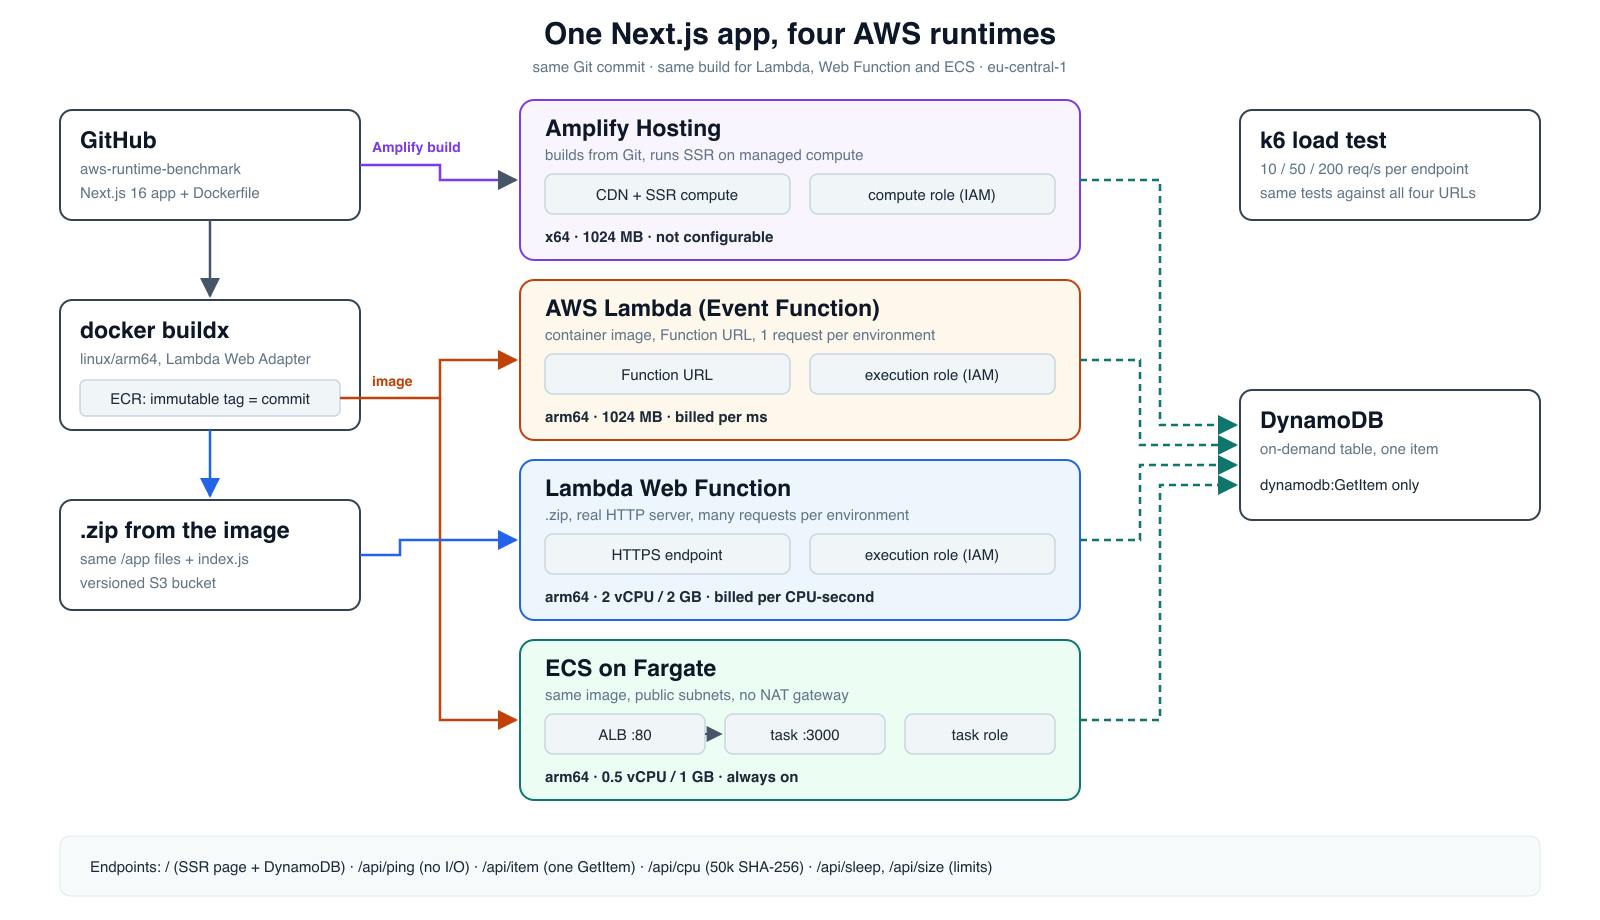
"Should this run on Amplify, Lambda or ECS?" is usually answered with a feature list. I wanted numbers. So I took one Next.js app, deployed it to four AWS runtimes in the same account and Region, including the new Lambda Web Functions, and measured the things that decide the choice in practice: latency under load, cold starts, CPU speed, real limits, and the monthly bill at four traffic levels.Lambda and ECS run the exact same container image, and the Web Function runs the same files from a .zip. Amplify Hosting builds the same Git commit. Every command, script, and result is in a public repository, with deploy and cleanup steps: Four results surprised me:One ECS Fargate task with 0.5 vCPU was the fastest option for light requests, then failed completely under load: at 200 requests per second, 29% of page requests returned errors, and ECS replaced the overloaded task twice during my tests.Lambda, Lambda Web Functions and Amplify kept the same latency from 10 to 200 requests per second with zero errors.The new Web Functions had the fastest CPU and no 6 MB response limit, but in my test they cost about four times as much as classic Lambda, because idle environments are billed for memory.Amplify cuts every request at about 28 seconds and every response at 6 MB, and classic Lambda behind a Function URL also stops at 6 MB.1. What we are buildingOne Next.js app deployed to Amplify Hosting, Lambda, a Lambda Web Function and ECS Fargate, all reading from one DynamoDB tableOne app, four runtimes, one DynamoDB table:Amplify Hosting builds the app from GitHub and runs the server-side code on its own managed compute.AWS Lambda (a classic function, which AWS now calls an Event Function) runs the container image through the Lambda Web Adapter, exposed with a Function URL. Each execution environment handles one request at a time.Lambda Web Functions run the same Next.js server from a .zip as a real HTTP server, with no adapter. Each environment handles many requests at once, and you pay for active CPU time instead of wall-clock time.Amazon ECS on Fargate runs the same image as a service behind an Application Load Balancer.The app has a few endpoints, each testing something different:/: a server-rendered page that reads one DynamoDB item, the typical "real page"/api/ping: no I/O at all, to measure the runtime's own overhead/api/item: one DynamoDB GetItem, a typical API call/api/cpu: 50,000 chained SHA-256 hashes, to compare the CPU you actually get/api/sleep and /api/size: to find the real request timeout and response size limitEvery response reports which runtime served it, the CPU architecture, and whether it was the first request of that process (a cold start):{"runtime":"lambda","cold":true,"requestsServed":1,"arch":"arm64","node":"v22.23.5","memoryMb":1024} 2. Prerequisites and costAn AWS account and the AWS CLI v2 with credentials for it. Web Functions need a recent version with the aws lambda-web commands (I used 2.40.4); run aws lambda-web help to check.Docker with buildx, Node.js 22, and k6 for the load testsA GitHub account for Amplify HostingEverything runs in eu-central-1. Lambda and Fargate use arm64 (Graviton) and roughly the same size: Lambda with 1024 MB of memory, and a Fargate task with 0.5 vCPU and 1 GB. A Web Function environment has a fixed size of 2 arm64 vCPUs and 2 GB, which you can't change, and Amplify chooses its own compute.While the setup is running, the only fixed cost is the ECS part: the load balancer, one Fargate task and four public IPv4 addresses, about $1.90 per day. Lambda, Amplify and DynamoDB cost close to nothing at test traffic. Run the cleanup script when you are done.3. The app and one image for two runtimesThe app is a normal Next.js app router project. The only special setting is the standalone output, which produces a small self-contained server.js for the container. Amplify builds the app its own way, so the setting is applied only in the Docker build:const config: NextConfig = { output: process.env.STANDALONE ? "standalone" : undefined, poweredByHeader: false, }; The Dockerfile is where Lambda and ECS meet:FROM node:22-alpine COPY --from=public.ecr.aws/awsguru/aws-lambda-adapter:0.9.1 /lambda-adapter /opt/extensions/lambda-adapter WORKDIR /app ENV NODE_ENV=production PORT=3000 HOSTNAME=0.0.0.0 \ AWS_LWA_READINESS_CHECK_PATH=/api/health COPY --from=build /app/.next/standalone ./ COPY --from=build /app/.next/static ./.next/static RUN rm -rf .next/cache && ln -s /tmp/next-cache .next/cache USER node CMD ["node", "server.js"] Three lines do the work:The Lambda Web Adapter is copied into /opt/extensions. Lambda starts everything in that folder as an extension, and the adapter turns each invoke event into a normal HTTP request to localhost:3000. On ECS, nothing starts it, so the same image is a plain web server.The readiness check path points to a separate /api/health route. My first version used /api/ping, and the adapter's readiness probe became the "first request" of every process, so no request ever looked cold. Health checks should not touch the code you measure.The Next.js cache is moved to /tmp, because Lambda's file system is read-only everywhere else.Build for arm64 and push to ECR:aws ecr create-repository --repository-name runtime-benchmark \ --image-tag-mutability IMMUTABLE --image-scanning-configuration scanOnPush=true docker buildx build --platform linux/arm64 --provenance=false \ -t "$REPO_URI:$IMAGE_TAG" --push . --provenance=false keeps a plain single-platform image. By default, buildx adds an attestation manifest and pushes an image index, which Lambda may refuse to use. The script tags each image with the Git commit, so an immutable tag always matches one commit.ECR scan on push found one critical CVE in the base imageScan on push found one critical CVE on the first push, in zlib from the node:22-alpine base image, not in the app. Base images are rebuilt on a schedule, so security fixes can be days old before they reach the tag you pull. One line in the final stage fixed it:RUN apk upgrade --no-cache The next image scanned with zero findings. The compressed image is 88 MB in ECR (233 MB unpacked).The DynamoDB table is on-demand with one item. Each runtime gets its own IAM role with exactly one permission, dynamodb:GetItem on this table.4. Lambda with a Function URLaws lambda create-function --function-name runtime-benchmark --package-type Image \ --code ImageUri="$REPO_URI:$IMAGE_TAG" --architectures arm64 \ --role "$ROLE_ARN" --memory-size 1024 --timeout 30 \ --environment "Variables={RUNTIME_NAME=lambda,TABLE_NAME=runtime-benchmark,APP_REGION=eu-central-1}" aws lambda create-function-url-config --function-name runtime-benchmark --auth-type NONE aws lambda add-permission --function-name runtime-benchmark --statement-id public-url \ --action lambda:InvokeFunctionUrl --principal '*' --function-url-auth-type NONE aws lambda add-permission --function-name runtime-benchmark --statement-id public-invoke \ --action lambda:InvokeFunction --principal '*' --invoked-via-function-url A public Function URL now needs both permissions: lambda:InvokeFunctionUrl, and lambda:InvokeFunction limited to calls that come through the URL. I removed the second one to check, and the URL answered with 403 and a helpful message:{"Message":"Forbidden. Invoking a Function URL requires both the lambda:InvokeFunctionUrl and lambda:InvokeFunction permissions."} Lambda function with a Function URL, 1024 MB memory and a 30 second timeoutA Function URL is free and needs no API Gateway. For production, you would usually put CloudFront in front of it for a custom domain, caching and AWS WAF.The quota that new accounts don't tell you aboutBefore load testing, check this:aws lambda get-account-settings --query 'AccountLimit.ConcurrentExecutions' 10 The documented default is 1,000 concurrent executions, but my account had 10. Ten concurrent requests at about 100 ms each is roughly 100 requests per second, and anything above returns 429 Too Many Requests. I requested an increase in Service Quotas (quota code L-B99A9384).Service Quotas: Lambda concurrent executions applied value 10, AWS default 1,000The increase to 1,000 was approved automatically after 2 hours and 20 minutes. Lambda's fast endpoints need far less concurrency than you might expect: at about 40 ms per request, 50 requests per second keep only 2 to 3 environments busy. The CPU endpoint at 50 requests per second peaked at 57 concurrent executions, well over the original limit.5. Lambda Web FunctionsLambda Web Functions are a new kind of Lambda function for HTTP traffic. Your code is a normal web server that listens on a port, Lambda gives it an HTTPS endpoint, and each execution environment serves many requests at the same time, like a container. It still scales to zero when there is no traffic.There are a few rules:Node.js only (nodejs24.x), deployed as a .zip from a versioned S3 bucket. No container images.Arm64 only. Each environment has 2 vCPUs and 2 GB of memory, and you can't change that.Your server must listen on the address in AWS_LAMBDA_HTTP_ENDPOINT (host:port) within 10 seconds of startup.Each environment handles up to 64 concurrent requests by default (maxConcurrencyPerEnvironment, 1 to 128), and Lambda lowers that limit dynamically based on resource usage.The Next.js standalone server reads HOSTNAME and PORT instead, so the entry file maps one to the other:// index.js: the Web Function entry file const [host, port] = (process.env.AWS_LAMBDA_HTTP_ENDPOINT || "localhost:3000").split(":"); process.env.HOSTNAME = host; process.env.PORT = port; require("./server.js"); To keep the comparison fair, I didn't rebuild the app. The deploy script copies /app out of the same linux/arm64 container image, adds index.js, and deploys that folder:cid=$(docker create --platform linux/arm64 "$REPO_URI:$IMAGE_TAG") docker cp "$cid:/app/." build/web-function/ && docker rm "$cid" cp web-function/index.js build/web-function/ aws lambda-web deploy --name runtime-benchmark-web --code build/web-function \ --create --include-hidden-files \ --execution-role-arn "$ROLE_ARN" \ --env RUNTIME_NAME=lambda-web --env TABLE_NAME=runtime-benchmark --env APP_REGION=eu-central-1 \ --timeout-seconds 30 --endpoint-name main --auth-type ApplicationManaged --include-hidden-files is easy to miss: the Next.js build lives in .next, and without the flag the command leaves hidden folders out of the package. deploy creates the S3 bucket, the function, the first revision and a public endpoint, and waits until the endpoint is active. My first deploy took under a minute.Lambda Web Function overview with its active HTTPS endpointA revision is an immutable snapshot of code and configuration. Changing an environment variable means a new revision, and an endpoint can route traffic to one revision or split it between two, which gives you canary deployments without CodeDeploy.Web Function revision configuration: nodejs24.x, 30 second timeout, maximum concurrency per environment 64The pricing model is different from classic Lambda. In eu-central-1 you pay $0.30 per million requests, $0.000035 per vCPU-second of CPU time that your code actually uses, and $0.0000046 per GB-second of memory for the whole life of each environment. A request that waits for DynamoDB uses almost no CPU, so it costs very little. But an environment that stays alive costs memory time even between requests: one environment kept alive for a month is about $24 in memory alone.6. ECS Fargate behind a load balancer, without a NAT gatewayA Fargate task in a private subnet needs a NAT gateway or VPC endpoints to pull its image, and either costs more than the task itself. For this test, the tasks run in public subnets with a public IP, and the security groups do the protecting:The ALB security group allows port 80 from the internetthe task security group allows port 3000 only from the ALB security groupaws ecs register-task-definition --family runtime-benchmark \ --requires-compatibilities FARGATE --network-mode awsvpc --cpu 512 --memory 1024 \ --runtime-platform cpuArchitecture=ARM64,operatingSystemFamily=LINUX \ --execution-role-arn "$EXEC_ROLE_ARN" --task-role-arn "$TASK_ROLE_ARN" \ --container-definitions file://container.json aws ecs create-service --cluster runtime-benchmark --service-name runtime-benchmark \ --task-definition runtime-benchmark --desired-count 1 --launch-type FARGATE \ --network-configuration "awsvpcConfiguration={subnets=[$SUBNETS],securityGroups=[$TASK_SG],assignPublicIp=ENABLED}" \ --load-balancers targetGroupArn="$TG_ARN",containerName=app,containerPort=3000 Two roles, two jobs: the execution role lets ECS pull the image and write logs, and the task role is what your code runs as. The DynamoDB permission goes on the task role only.Two settings save time on every deploy. The target group health check uses /api/health every 10 seconds with a healthy threshold of 2, so a new task gets traffic in about 20 seconds. The deregistration delay is 10 seconds instead of the default 300, so an old task stops quickly.One bug from my script is worth sharing: --output text separates a list of subnet IDs with tabs, not spaces. My script turned spaces into commas, so the service request got one "subnet ID" with tabs inside and failed with Subnet ID must match subnet-[0-9a-f]+. Pipe the list through tr '\t' ' '.ECS service with one running Fargate task and a healthy load balancer target7. Amplify HostingAmplify Hosting connects to GitHub with its own GitHub App. It does not use an AWS CodeConnections connection, even if you already have one for CodeBuild or CodePipeline. So the first step is in the console: Create new app, GitHub, choose the repository and the main branch. Amplify detects Next.js and uses the amplify.yml from the repository.Amplify Hosting app with the main branch deployedEnvironment variables don't reach your server codeThis is the biggest surprise for anyone coming from Lambda or ECS. Amplify passes environment variables to the build, not to the server-side code at runtime. The fix is to write the variables your server code needs into .env.production during the build:build: commands: - env | grep -E '^(RUNTIME_NAME|TABLE_NAME|APP_REGION)=' >> .env.production || true - npm run build The || true is there because my first build failed without it. Before the variables were set, grep found nothing and exited with code 1, and Amplify stopped the build with "Command failed with exit code 1".Amplify build log: the env | grep command failed with exit code 1Amplify deployment history: the first build failed, the next two deployedTwo more rules: variable names can't start with AWS_, so the app reads APP_REGION instead of AWS_REGION, and secrets should not go into .env.production this way, because they end up in the build artifact.The compute roleThe server-side code needs AWS credentials to call DynamoDB. Amplify calls this a compute role: an IAM role that amplify.amazonaws.com can assume.aws iam create-role --role-name runtime-benchmark-amplify-compute \ --assume-role-policy-document file://amplify-trust.json aws amplify update-app --app-id "$APP_ID" --platform WEB_COMPUTE \ --compute-role-arn "$COMPUTE_ROLE_ARN" \ --environment-variables RUNTIME_NAME=amplify,TABLE_NAME=runtime-benchmark,APP_REGION=eu-central-1 Without a compute role, the page renders but the DynamoDB call fails with a credentials error.Amplify IAM roles page with the compute role for server-side codeWhat Amplify runs onThe first response from Amplify answered a question the console doesn't:{"runtime":"amplify","cold":true,"arch":"x64","memoryMb":1024} AWS_LAMBDA_FUNCTION_MEMORY_SIZE is set, so the server code runs on Lambda with 1024 MB, on x64, managed by Amplify. You can't choose the memory size or arm64, and it doesn't count against your account's Lambda concurrency quota.8. How I measuredClient: k6 on a laptop in London, against the default URL of each runtime. Absolute latencies include my network path; the differences between runtimes are what matter.Load: a constant arrival rate (k6 constant-arrival-rate) of 10, 50 and 200 requests per second for 2 minutes per endpoint, with p50, p95 and p99.Cold starts: for Lambda, the script changes an environment variable before each request, which retires all warm environments, and repeats this 10 times. For Amplify, it sends one request after 20 minutes of no traffic. ECS has no cold starts while a task runs.Limits: /api/sleep and /api/size with increasing values.k6 run -e BASE_URL=$URL -e ENDPOINT=/api/item -e RATE=50 -e DURATION=2m bench/load.js bench/coldstart.sh lambda 10 bench/limits.sh lambda $URL 9. ResultsLatency under loadAt 10 requests per second (p50 / p95 / p99 in milliseconds, 1,200 requests each):EndpointLambdaWeb FunctionECS FargateAmplify/ (SSR + DynamoDB)42 / 110 / 13143 / 138 / 18329 / 93 / 11770 / 148 / 1751/api/item38 / 101 / 12536 / 123 / 20325 / 85 / 11153 / 120 / 136/api/cpu155 / 226 / 273102 / 200 / 276failed206 / 302 / 477On light requests, ECS is the fastest, Lambda and the Web Function are close behind with almost the same medians, and Amplify is about 1.5 times slower than Lambda. ECS wins here because nothing sits between the load balancer and a warm Node.js process.The CPU row is the surprise. One Fargate task with 0.5 vCPU could not keep up with 10 CPU-heavy requests per second: each request needs about 80 to 150 ms of CPU, so the work arrived faster than half a vCPU could do it. Requests queued, the ALB health checks timed out, and ECS replaced the "unhealthy" task in the middle of the test. 8% of requests failed and the median rose to 1.9 seconds. Lambda, the Web Function and Amplify handled the same load without errors, because they add execution environments as the load grows.The lesson is not that ECS is slow. A fixed-size service needs auto scaling and headroom, and a health check that shares the CPU with the work it checks can turn an overload into a restart.At 200 requests per second (p50 / p95 / p99 in milliseconds, 24,000 requests each):EndpointLambdaWeb FunctionECS Fargate (1 task)Amplify/ (SSR + DynamoDB)42 / 116 / 28145 / 132 / 20029% errors, p50 222787 / 230 / 1702/api/item36 / 105 / 12641 / 132 / 23658 / 2375 / 1949667 / 172 / 340/api/cpu182 / 258 / 29796 / 187 / 255not tested217 / 312 / 373Lambda, the Web Function and Amplify barely noticed the twentyfold increase: their medians moved by a few milliseconds and no request failed. For the Web Function, I ran the 200 requests per second test twice, because AWS says the first load test on a new Web Function scales conservatively, and the table shows the second run. The two runs were within a few milliseconds of each other. Lambda scaled to 234 concurrent executions in the first seconds of the test, then settled between 50 and 90, with zero throttles.The single ECS task reached 100% CPU and failed. At 50 requests per second the same task used about 65% CPU on the page endpoint, so one 0.5 vCPU task handles roughly 70 page requests per second before it falls over. For real traffic, you would run at least two tasks with target tracking auto scaling at 50 to 60% CPU.The 50 requests per second results look like the 10 requests per second ones for Lambda, ECS and Amplify, so I left them in the repository instead of adding another table.One more number explains why Lambda looks so fast: its billed duration (the CloudWatch Duration metric) was 9 to 16 ms at the median for the light endpoints. Most of the 40 ms that the client sees is the network and the Function URL, not your code.CPUThe CPU endpoint does the same 50,000 hashes everywhere:Lambda, 1024 MB, arm64: about 150 ms billed duration per request, 155 to 182 ms at the clientWeb Function, 2 vCPUs, arm64: 96 to 102 ms at the median at the client, the fastest of the fourAmplify, x64: 204 to 217 ms at the clientFargate, 0.5 vCPU, arm64: 79 ms for a single request on an idle task, but it cannot sustain that: at 10 requests per second the task collapsedLambda gives CPU in proportion to memory: one full vCPU at 1,769 MB. At 1024 MB you get a bit more than half a vCPU, and you pay for the milliseconds you use. A Web Function environment always has 2 vCPUs, and you pay only for the CPU time you use. Node.js runs JavaScript on one thread, so a single request can use only one of them, but that one is a full vCPU. Fargate gives you exactly the vCPU you reserve, all the time, whether you use it or not.Cold startsLambda, 10 forced cold starts (the script changes an environment variable before each request):Init Duration in the Lambda logs: 768 to 941 ms, about 820 ms at the medianFirst request at the client: 1.04 to 1.36 s, about 1.1 s at the medianThe next request on the same environment: 100 to 195 msThe very first cold start after deploying a new image took 3.7 s of init and 4.2 s at the client, because Lambda had not cached the new image yetAmplify, one request after 20 minutes without traffic, 3 times: 1.94 s, 2.00 s and 0.33 s, compared with about 0.16 s for a warm request. All three were served by a new process, so the third one probably landed on an environment that Amplify had already prepared. You can't see or control this, so plan for about 2 seconds on the first request after a quiet period.Web Function, 5 forced cold starts (each run creates a new revision, which starts new environments):First request at the client: 0.95 to 1.21 s, about 1.02 s at the medianThe next request on the same environment: 140 to 300 msAfter the 200 requests per second test ended, the environments stayed alive for about 5 minutes before Lambda removed them. One environment that I woke up with 7 requests stayed alive for more than 6 minutes. A site that gets a request every few minutes will rarely see a Web Function cold start, and that matters for the cost below.ECS has no cold start while a task is running, which is what you pay the fixed monthly price for. Scaling out is a different story: in the ECS events, a replacement task registered with the load balancer about 25 seconds after it started, and then needed two 10-second health checks before it got traffic. A new Lambda environment was ready in about one second.Real limitsI asked each runtime to wait longer and longer, and to return larger and larger responses:Request timeout. Lambda stopped at 30 seconds with 502, which is the function timeout I configured; you can raise it to 15 minutes. The Web Function stopped at 30 seconds with 504 and the header lambda-web-error-type: Runtime.RequestTimeout; its timeoutSeconds also goes up to 15 minutes. ECS stopped at 60 seconds with 504, the ALB idle timeout, which you can raise to 4,000 seconds. Amplify stopped every request at about 28 seconds with 504, and you can't change that.Response size. Lambda returned 5 MB but failed at 6 MB with 502, the payload limit for buffered responses. Amplify also returned 5 MB and failed at 6 MB, with 413. ECS returned 20 MB without trouble, because nothing between the ALB and the container limits the size. The Web Function also returned 20 MB, because it streams responses by default.If your app has report downloads, file exports or slow third-party calls, these limits decide more than any latency number. Classic Lambda can go beyond 6 MB with response streaming, but that needs code changes. With Web Functions, you get it without changes.10. What it costs per monthPrices are on-demand prices in eu-central-1 from the AWS Price List API, in November 2026, without free tiers:Lambda (arm64): $0.20 per million requests plus $0.0000133 per GB-second. The Function URL is free.Lambda Web Functions (arm64): $0.30 per million requests, $0.000035 per vCPU-second of CPU time actually used, and $0.0000046 per GB-second of memory for the whole life of each environment. Each environment has 2 GB, so one environment that stays alive all month costs $24.35 in memory.Amplify Hosting compute: $0.30 per million requests plus $0.20 per GB-hour, which is about $0.0000556 per GB-second, 4.2 times the Lambda arm64 rate. Data out is $0.15 per GB, and builds are $0.01 per minute.ECS: Fargate arm64 at $0.03725 per vCPU-hour and $0.00409 per GB-hour, so one 0.5 vCPU / 1 GB task is $16.58 per month. The ALB is $0.027 per hour ($19.71 per month) plus LCUs. Public IPv4 addresses are $0.005 per hour each: the ALB has one per Availability Zone and each task has one, so four addresses add $14.60 per month.What my Web Function test actually costWeb Functions publish their own usage in CloudWatch (EnvironmentCPUTime, EnvironmentActiveTime and ExecutedRequests in the AWS/Lambda/Web namespace), so I could calculate the real bill for my load tests instead of estimating it:147,608 requests in about 20 minutes3,966 vCPU-seconds of CPU, which is 27 ms per request on average48,354 environment-seconds (13.4 environment-hours) at 2 GB eachCost: $0.04 for requests, $0.14 for CPU, $0.45 for memory, $0.63 in total, or $4.28 per million requests71% of the bill was memory. At 200 requests per second, Lambda ran up to 55 environments, and none of them served more than 2 requests at the same time (the EnvironmentConcurrentRequests maximum). That was the case in both 200 requests per second runs. AWS documents that a new Web Function starts with a conservative per-environment concurrency limit and raises it as it learns, but I didn't see that happen in about 25 minutes of testing. About 30% of the memory time came after the test, while the environments waited about 5 minutes before Lambda removed them.The same request mix on classic Lambda would cost about $0.15, or $1.04 per million requests. So in my test, Web Functions cost about four times as much. If the per-environment concurrency grows over time, as AWS describes, this gap will shrink, so treat it as the cost of a new function under a load test, not a final verdict.Monthly cost at four traffic levelsFor the monthly bill, I used the measured durations: 20 ms of Lambda billed time per request (the 9 to 16 ms median, rounded up), and 5 KB per response. Amplify doesn't publish its billed compute time per request; its CloudWatch Latency metric averaged about 100 ms, which includes the CDN, so I show 100 ms as the upper bound and 30 ms as a likely lower bound. ECS uses the measured capacity of about 50 requests per second per task with headroom. For the Web Function, I used 27 ms of CPU per request, at least one environment alive all month (requests arrive more often than every 5 minutes at these levels), and the measured 0.24 environments per request per second at steady load.Requests per monthLambdaWeb FunctionAmplify (30 to 100 ms)ECS + ALB10,000$0.01up to $24$0.03 to $0.07$56.741 million$0.92$26$2.72 to $6.61$57.1810 million$9.17$37$27 to $66$61.23100 million$92$368$272 to $661$105Three things stand out:ECS has a floor of about $57 per month before the first request: $16.58 for the task, $19.71 for the ALB, about $6 for LCUs and $14.60 for four public IPv4 addresses. A second task for availability adds about $20.Web Functions have a soft floor of about $24 per month, one 2 GB environment kept alive by regular traffic. With traffic that stops for long periods, the environment scales to zero and the floor disappears. Above that floor, the CPU-based billing is cheap: 10 million requests add only about $12.Lambda stays cheapest until about 100 million requests per month for this light app. 100 million requests is 38 requests per second on average, so a real service would hit that level only with steady traffic.Heavy requests make both more expensive. At 150 ms per request (the CPU endpoint), Lambda costs about 7.5 times more than at 20 ms. But one 0.5 vCPU task sustains only about 3 such requests per second, so ECS needs many more tasks too. Per request they end up close, and Lambda still has no monthly floor.The script is in the repository (bench/cost.py), so you can run it with your own durations and response sizes.11. Which one to chooseChoose Amplify Hosting for a frontend-first app with light server-side code, when you want Git push to production with preview branches and no infrastructure work. Check the 28 second and 6 MB limits against your app first, and remember that it runs on x64 and its compute costs about four times as much per GB-second as Lambda on arm64.Choose Lambda Web Functions for Node.js web apps that need more than classic Lambda allows: responses over 6 MB, streaming, CPU-heavy requests (2 vCPUs per environment gave the fastest CPU results), or canary deployments between revisions without extra tooling. It needs no adapter and scaled to 200 requests per second with zero errors. Watch the memory bill: in my test, idle environments made it about four times as expensive as classic Lambda, so check EnvironmentActiveTime after your first week.Choose classic Lambda for APIs and server-rendered pages with spiky or low traffic. It scaled from 10 to 200 requests per second with no errors and no configuration, and costs almost nothing when idle. Design for cold starts of about one second, the 6 MB response limit, and check your account's concurrency quota before launch.Choose ECS Fargate for steady traffic, long requests, large responses, WebSockets or background work, and when you need private networking to a database. It had the lowest latency per request. But plan the capacity: run at least two tasks, add auto scaling, and accept the monthly floor.The same build runs on classic Lambda, Web Functions and ECS, so this is not a one-way decision. The Web Function in this article is the same /app folder as the container image, plus a 5-line index.js. Starting on Lambda and moving when your traffic or your limits change is a reasonable path.12. CleanupAPP_ID=d123abc infra/cleanup.sh The script deletes the Amplify app, the ECS service, cluster, load balancer and target group, the Lambda function, the Web Function and its code versions in the shared awscli-lambdaweb-* bucket, the security groups, the ECR repository, the DynamoDB table, the log groups and the IAM roles. Everything it created has the tag project=runtime-benchmark, so you can check in Tag Editor that nothing is left.13. ConclusionThe feature lists told me that ECS is "more powerful", Lambda is "serverless" and Amplify is "easy". The measurements told a more useful story. The always-on container was the fastest per request and the first to fail, because one task is a fixed amount of CPU. The three serverless options were a little slower per request but did not care whether traffic was 10 or 200 requests per second. The newest one, Lambda Web Functions, removes most of classic Lambda's limits and was the fastest on CPU, but its memory billing made it the most expensive serverless option in my test. And the limits that matter most for real apps, request timeout and response size, differ by an order of magnitude between them.If you only take one thing from this article: measure your own app on the runtime you plan to use, before you choose. The repository makes that a few commands, and the cleanup script removes everything when you are done.
Benchmarking AWS Amplify, Lambda, Web Functions, and ECS for Next.js
Full Article
Original Source
Read the full article at Hackernoon →KhanList aggregates and links to publicly available news content. We do not host full articles from third-party sources. Always verify important information with original sources.