
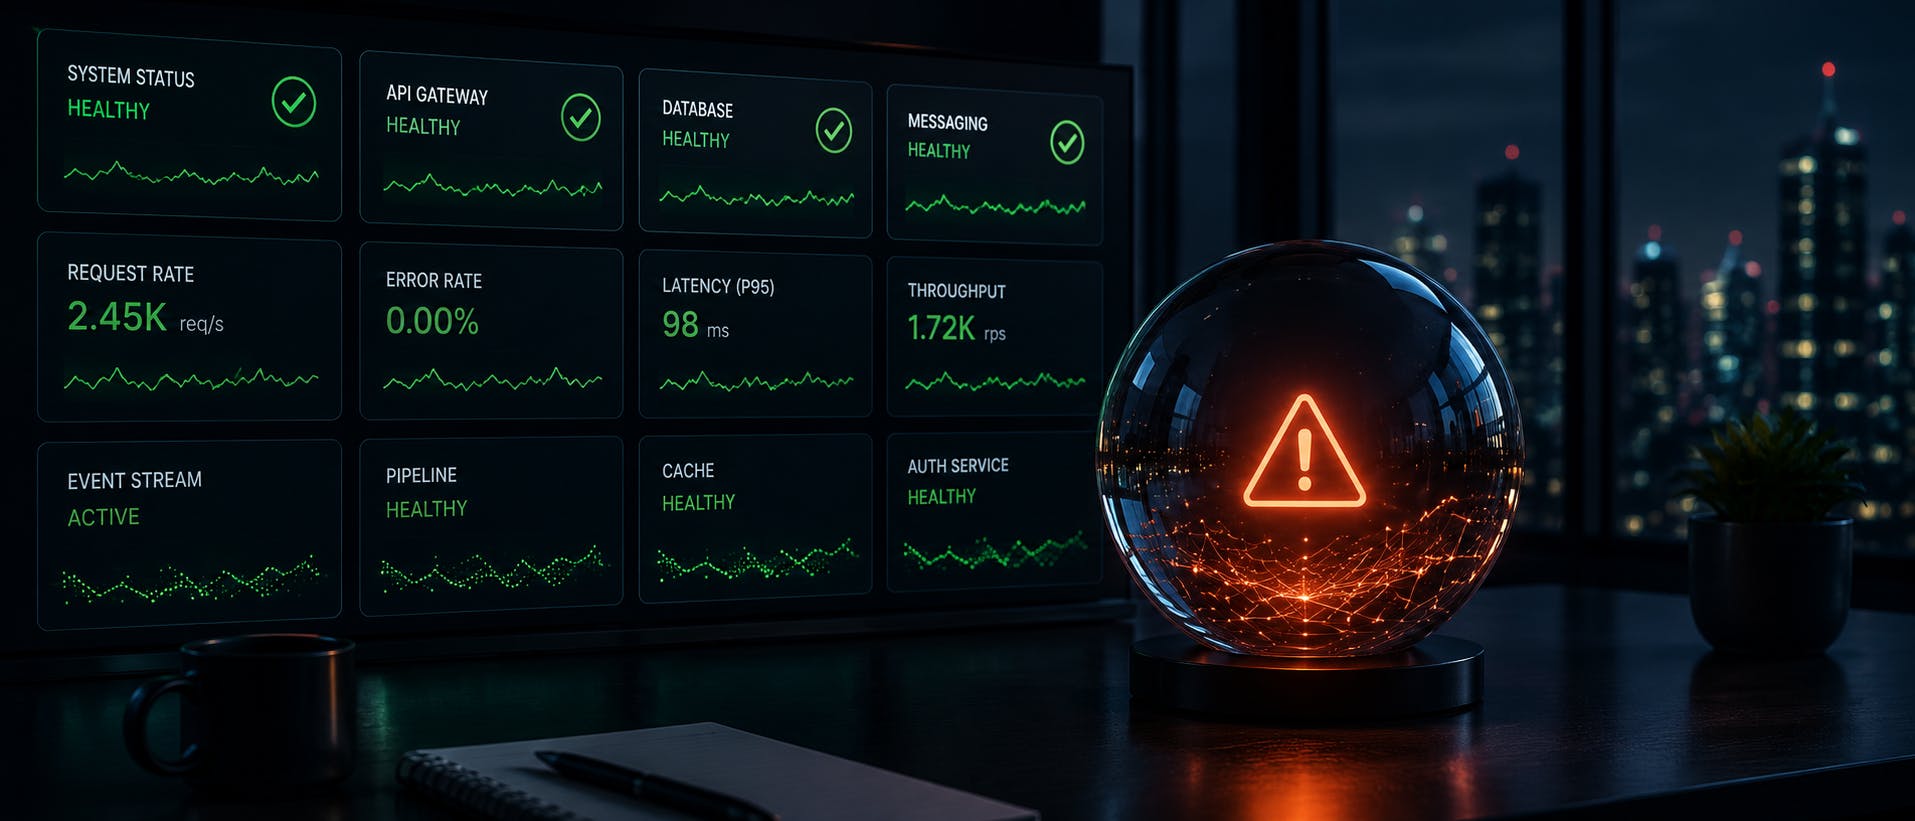
A crashed application is usually easy to recognize. A process stops, an endpoint fails, an alert fires, or users can no longer access the system. The harder production problems are the ones where nothing appears to be broken. The application is running. Users can log in. Dashboards load. APIs respond. The database is reachable. Monitoring shows healthy services. But the information moving through the system is no longer behaving as expected. I have encountered this type of problem while working with real-time, data-intensive applications. Sometimes the issue is stale data. Sometimes information is arriving, but processing is falling behind. In other cases, one external source has stopped communicating while everything else continues to operate normally. These failures are difficult because application availability can create a false sense of health. For real-time applications, I find it useful to ask two separate questions: Is the application running? Is the information still moving correctly through it? The second question is where many silent failures hide. What Is a Silent Data Failure? A silent data failure occurs when an application remains available, but some part of its information flow is no longer operating as expected. Consider a simplified real-time data path: Source → Ingestion → Processing → Data Store → API → Consumer Suppose the source stops sending updates. The ingestion process may continue running. The processing service has not crashed. The database remains reachable. The API can continue returning the most recently stored value. From the application's perspective, very little appears to have failed. From the consumer's perspective, however, the information may already be unreliable. The same problem can appear in less obvious ways. Information may still be arriving but several minutes late. One source may fail while others continue normally. A calculation may continue producing output using an input that has stopped updating. This is why application availability alone is not enough to describe the health of a real-time system. The Five Signals of Real-Time Data Health When I think about silent failures in data-intensive applications, I find five signals particularly useful: Freshness — Is the information current? Progression — Is new information actually arriving? Connectivity — Is the expected communication path available? Processing lag — Is the system keeping up? Data quality — Can the information be trusted? Looking at these signals together provides a much better picture than simply asking whether an application or service is UP. 1. Freshness: Is the Information Current? Freshness starts with a simple question: When did we last receive valid information? If a source normally updates every 30 seconds, a record that is 40 seconds old may not be concerning. If the newest record is 20 minutes old, something probably needs attention. There is no universal definition of stale. A source updating every few seconds and a process running once an hour require completely different thresholds. The important step is to define what "current" means for each source before a failure occurs. Once that expectation is measurable, monitoring can identify when the information moves outside its normal freshness window. 2. Progression: Is New Information Actually Arriving? Freshness alone does not always tell the complete story. One common approach is to check whether a value has changed. But an unchanged value does not necessarily mean the feed has stopped. Imagine receiving: 50.0 → 50.0 → 50.0 → 50.0 That could be a frozen feed. It could also be a perfectly valid measurement that has remained at 50. The better question is whether a new observation was received. Timestamps, sequence numbers, message identifiers or heartbeats can help distinguish a legitimate constant value from information that has stopped progressing. This is especially important in real-time applications where valid values may remain unchanged for extended periods. 3. Connectivity: Is the Expected Path Available? Real-time applications often depend on multiple external sources and interfaces. One connection can disappear while the application itself remains fully accessible. This creates a partial failure. Instead of representing the entire application as simply UP or DOWN, monitoring should make it possible to understand which expected connections are available and which are not. Connectivity also needs context. A running process does not prove that it is successfully communicating with the system on the other end. Knowing the state of individual communication paths gives engineers much better information when diagnosing an incident and allows unaffected parts of the application to continue operating. 4. Processing Lag: Is the System Keeping Up? Receiving data does not necessarily mean consumers are receiving it on time. A system may continue ingesting events while processing gradually falls behind. No service has failed, but the difference between the source and the consumer keeps growing. Eventually, a supposedly real-time application may be showing information several minutes behind the source. This is why latency should not only be measured at the API layer. Comparing source time, processing time and consumption time can reveal whether information is moving through the pipeline at the expected pace. For systems where decisions depend on timely information, processing lag can be just as important as availability. 5. Data Quality: Can the Information Be Trusted? Current information is not automatically good information. A source can be connected and updating normally while sending incomplete, invalid or unexpected data. The validation required will depend on the application. It might include checking required fields, status indicators, timestamp consistency, expected ranges or relationships between related values. The important point is that receiving something is not the same as receiving something usable. A complete health model should therefore ask not only whether data arrived, but whether the application can trust what arrived. Build Health Around the Data Path Once these signals are available, everything does not need to be immediately reduced to UP or DOWN. I prefer thinking in terms of states such as: Healthy → Degraded → Stale or Failed Healthy means information is progressing within expected conditions. Degraded means something is outside normal expectations, but the application can still provide useful functionality. Stale or failed means the condition has exceeded an acceptable threshold or the information should no longer be trusted for its intended use. This distinction matters because restarting a healthy application will not fix an upstream source that has stopped publishing. This is similar to the distinction Kubernetes makes between liveness and readiness probes: liveness can determine when a container should be restarted, while readiness determines whether it should receive traffic. Making an entire application unavailable because one source is delayed can also create a larger problem than the original failure. A degraded state allows the system to communicate uncertainty without unnecessarily becoming unavailable. Monitor End to End Another lesson from working with real-time applications is that monitoring only the final application makes troubleshooting much harder. Observability should follow the information through the complete path. Traditional metrics, logs and traces remain important, but data-intensive applications also need visibility into whether information itself is progressing At the source, understand connectivity and expected activity. At ingestion, track when information was last successfully received. During processing, measure whether information is keeping pace. At storage, understand the age of the newest usable record. At the application layer, provide enough context for consumers to understand whether the information is current. This approach provides more than an alert. It gives engineers clues about where a problem started. If ingestion is current but processing lag keeps increasing, investigation can focus on processing. If processing appears healthy but the newest stored record is old, engineers have a different problem. Good monitoring should narrow the search, not simply announce that something is wrong. Alert on Conditions That Need Action Adding more monitoring can easily create another problem: alert noise. A single late update may not justify an alert. Short network interruptions, processing spikes and normal variations happen in production. Duration matters. One missed update might move a source into a degraded state. Several consecutive missed cycles may justify escalation. This persistence-based approach is similar to Prometheus alerting rules with a ‘for‘ duration, where a condition must remain active for a specified period before the alert fires. A prolonged failure may require a higher-priority response. Recovery is equally important. When information starts progressing normally again, the monitoring state should recover automatically where possible. The objective is not to notify engineers about every unusual event. It is to create alerts with high signal and low noise that tell engineers when something actually requires action. Design for Partial Failure Real-time applications often depend on multiple sources, services and connections. Eventually, one of them will fail independently of the others. The architecture should decide what happens before that failure occurs. Can unaffected information continue to be served? How old can the last known information become before it should no longer be used? Can a calculation continue if one of its inputs becomes stale? Should consumers receive degraded information, or should a particular operation be blocked? These are application-design decisions, not just monitoring decisions. A system that understands partial failure can continue providing useful functionality while clearly identifying what has degraded. A system that does not understand partial failure may either hide the problem or unnecessarily fail everything. A Practical Real-Time Data Health Checklist Before calling a real-time application healthy, I would ask: Are the application and required services available? Are expected external sources connected? When was the last valid update received from each source? Are timestamps, sequence numbers or heartbeats progressing? Is processing keeping pace with incoming information? Is the newest information within its expected freshness threshold? Is incoming information passing the required quality checks? Can consumers distinguish healthy information from degraded information? Will a persistent problem generate an actionable alert? Will monitoring recognize when normal data flow has recovered? Not every application needs every check. But asking these questions can reveal gaps that ordinary infrastructure monitoring may miss. Follow the Data Real-time systems do not always fail cleanly. Sometimes a process crashes and the problem is obvious. Other times every service remains green while information quietly stops moving, falls behind or becomes unreliable. Those failures require us to look beyond application availability. Freshness tells us whether information is current. Progression tells us whether new observations are arriving. Connectivity tells us whether the expected path is intact. Processing lag tells us whether the pipeline is keeping pace. Data quality tells us whether the information can actually be trusted. Together, these five signals provide a more complete picture of real-time application health. A running application tells us the software is alive. Data that is current, progressing and trustworthy tells us the system is still useful.
Silent Data Failures: How to Detect When Real-Time Applications Look Healthy but Aren’t
Full Article
Original Source
Read the full article at Hackernoon →KhanList aggregates and links to publicly available news content. We do not host full articles from third-party sources. Always verify important information with original sources.