
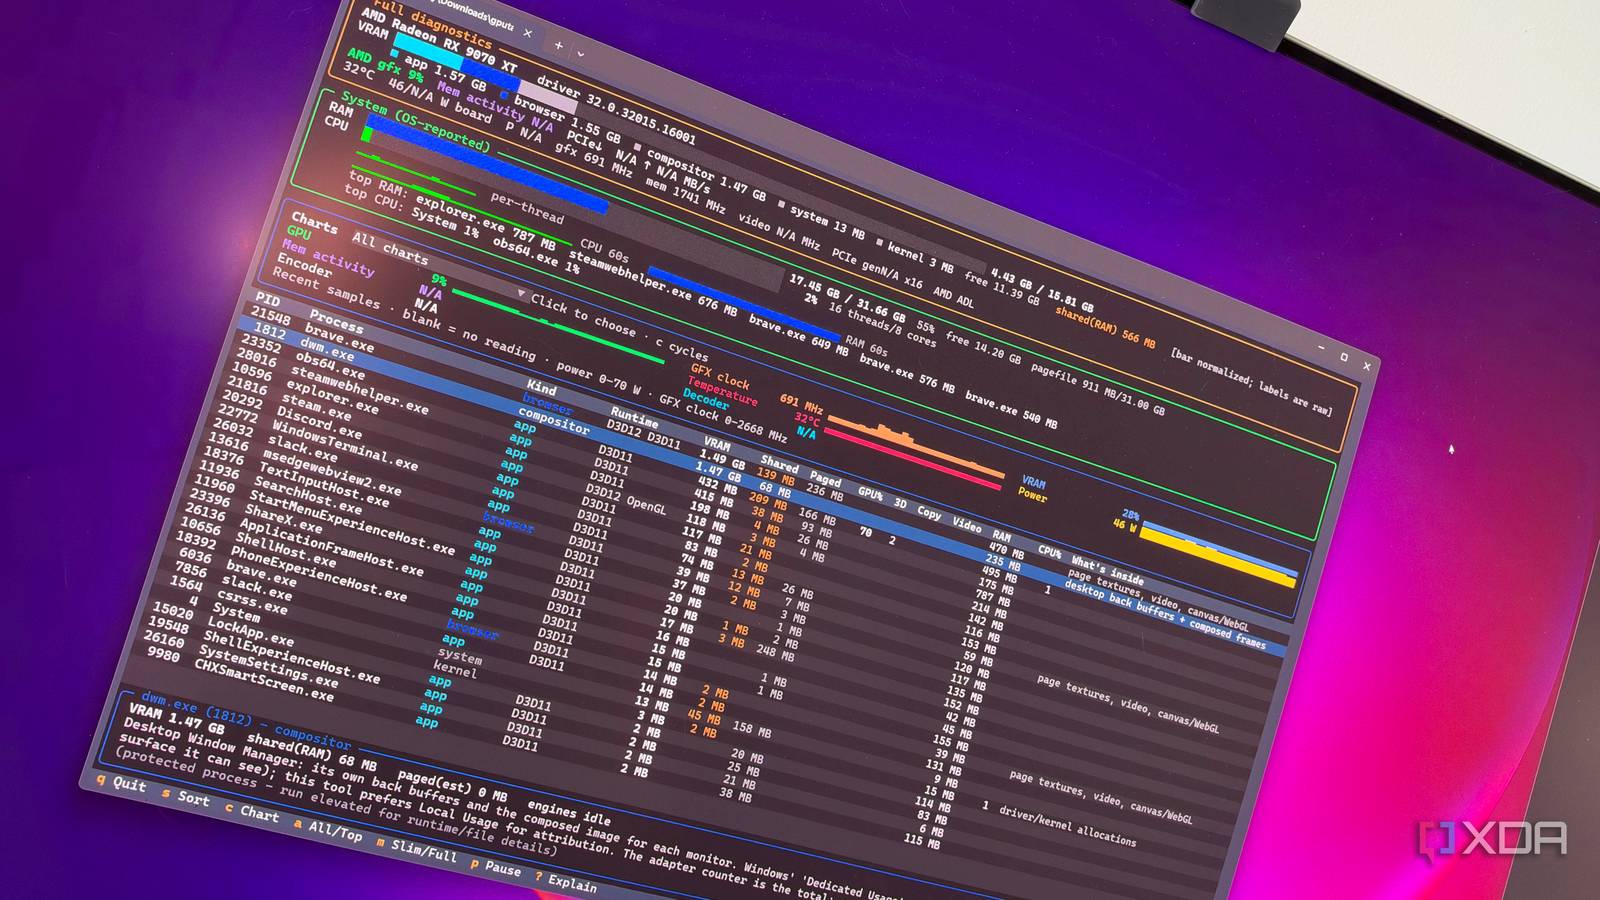
Published Nov 19, 2026, 7:30 AM EST His love of PCs and their components was born out of trying to squeeze every ounce of performance out of the family computer. Tinkering with his own build at age 10 turned into building PCs for friends and family, fostering a passion that would ultimately take shape as a career path. Besides being the first call for tech support for those close to him, Ty is a computer science student, with his focus being cloud computing and networking. He also competed in semi-pro Counter-Strike for 8 years, making him intimately familiar with everything to do with peripherals. VRAM is as good as gold these days, both within the context of high-resolution gaming and running local AI. Knowing where it all goes is important, but on Windows, there's no itemized breakdown of exactly what those applications and processes are doing with that valuable memory, and that's why gputaskman was made. Scott Hanselman, a VP at Microsoft, released gputaskman on GitHub, and it shows exactly which processes are eating up your GPU. It's completely open-source, runs in a terminal, and is invaluable if you handle workloads that touch VRAM. Task Manager tells you how much, but not exactly what it's doing There's no clear picture as to what your VRAM is actually doing Task Manager has been able to show how much of your VRAM is being used for years, but it only gives you a couple of numbers to go off of. If I load up a local model in llama.cpp and open a few browser tabs with video elements, the usage will jump, but I have no idea what each load is actually doing with that memory. Local LLMs on consumer GPUs can easily take up all of your VRAM, but it's important to know what else might be leaking into that GDDR memory. The Performance tab in Task Manger charts dedicated and shared GPU memory for the whole card, and if you add the Dedicated GPU memory column in the Details tab, you get a figure for each process too. On Windows, gputaskman reads from the same family of graphics counters, so the totals line up closely, but you get a much clearer picture of what’s using memory. gputaskman sorts every process into a type and labels them: LLM, compositor, browser, app or system. It notes which graphics runtime each process is using and adds a short description of what its memory probably holds, if possible. The device panel at the top rolls all of that into one stacked bar, so you can see at a glance how much of the card belongs to the model and how much belongs to everything else. What was actually in my VRAM I didn't realize my browser took up so much After I loaded up Qwen3-8B, 7.37GB of my RX 9070 XT's 15.81GB was in use, and more than 4GB of that had nothing to do with the model. The Windows compositor, dwm.exe, was holding 1.37GB, which gputaskman describes as desktop back buffers and compositor surfaces. This, of course, makes a lot of sense, because I run a 4K 240Hz monitor, but I’d never seen it itemized like that before. Brave was using 1.14GB for things like page textures, video and canvas. OBS, which handles my replay buffer for game clips, had 445MB, and Steam’s web helper had 298MB, and a long tail of apps like Discord, Slack and even File Explorer held around a hundred megabytes each. On a 16GB card that's roughly a quarter of the VRAM capacity gone before the model actually does anything. If you're trying to load a model and it fits via the math but doesn't in reality, check gputaskman before blaming the model. The model inspector is the biggest reason to try it A feature that makes it a must-have If you select llama-server in the process list, gputaskman will give a bunch of extra detail on top of just the type of process and its usage. It'll identify the model, what architecture it uses, how many parameters, quantization, and the training context. It'll also split the allocation: 4.35GB of weights, 576MB of KV cache and 108MB of compute buffers, the numbers for which are read straight from llama.cpp's logs. The KV cache amount helps explain a common misread of usage details, and that's why a model can take up more space in VRAM than its file size. gputaskman illustrates this by listing the cost per token, 144KB at the default f16 precision for this model, and does the math for you: 576MB at a 4K context, 4.5GB at 32K. llama.cpp reserves that memory when the model loads. Without the log file, the KV figures are estimates based on the model file’s metadata. gputaskman can also recognize Ollama, LM Studio, vLLM and Foundry Local out of the box, though the README is upfront that some of those paths have seen less real-world testing than llama.cpp. It's experimental You'll probably get more detail than I can if you're on an Nvidia card Credit: Scott Hanselman This software is a work-in-progress judging by the readme and GitHub history. Things like the device and process counters are measurements but workload labels and model breakdowns are estimates, and may be wrong. AMD owners on Windows like myself get less detail than Nvidia owners would on their cards. On my RX 9070 XT, memory activity, PCIe traffic and video clock all read N/A, because gputaskman relies on AMD’s driver library there instead of the richer telemetry NVIDIA cards expose. A no-brainer install for local AI enthusiasts If you run local models in basically any capacity, gputaskman is a great program to try. It runs on basically every OS and runs directly in a terminal, so its footprint is quite tiny. Compared to Task Manager on Windows, it's a must-have for local AI enthusiasts.
I replaced Task Manager’s GPU tab with a free open-source tool, and finally found where my VRAM was going
Full Article
Original Source
Read the full article at Xda-developers →KhanList aggregates and links to publicly available news content. We do not host full articles from third-party sources. Always verify important information with original sources.