
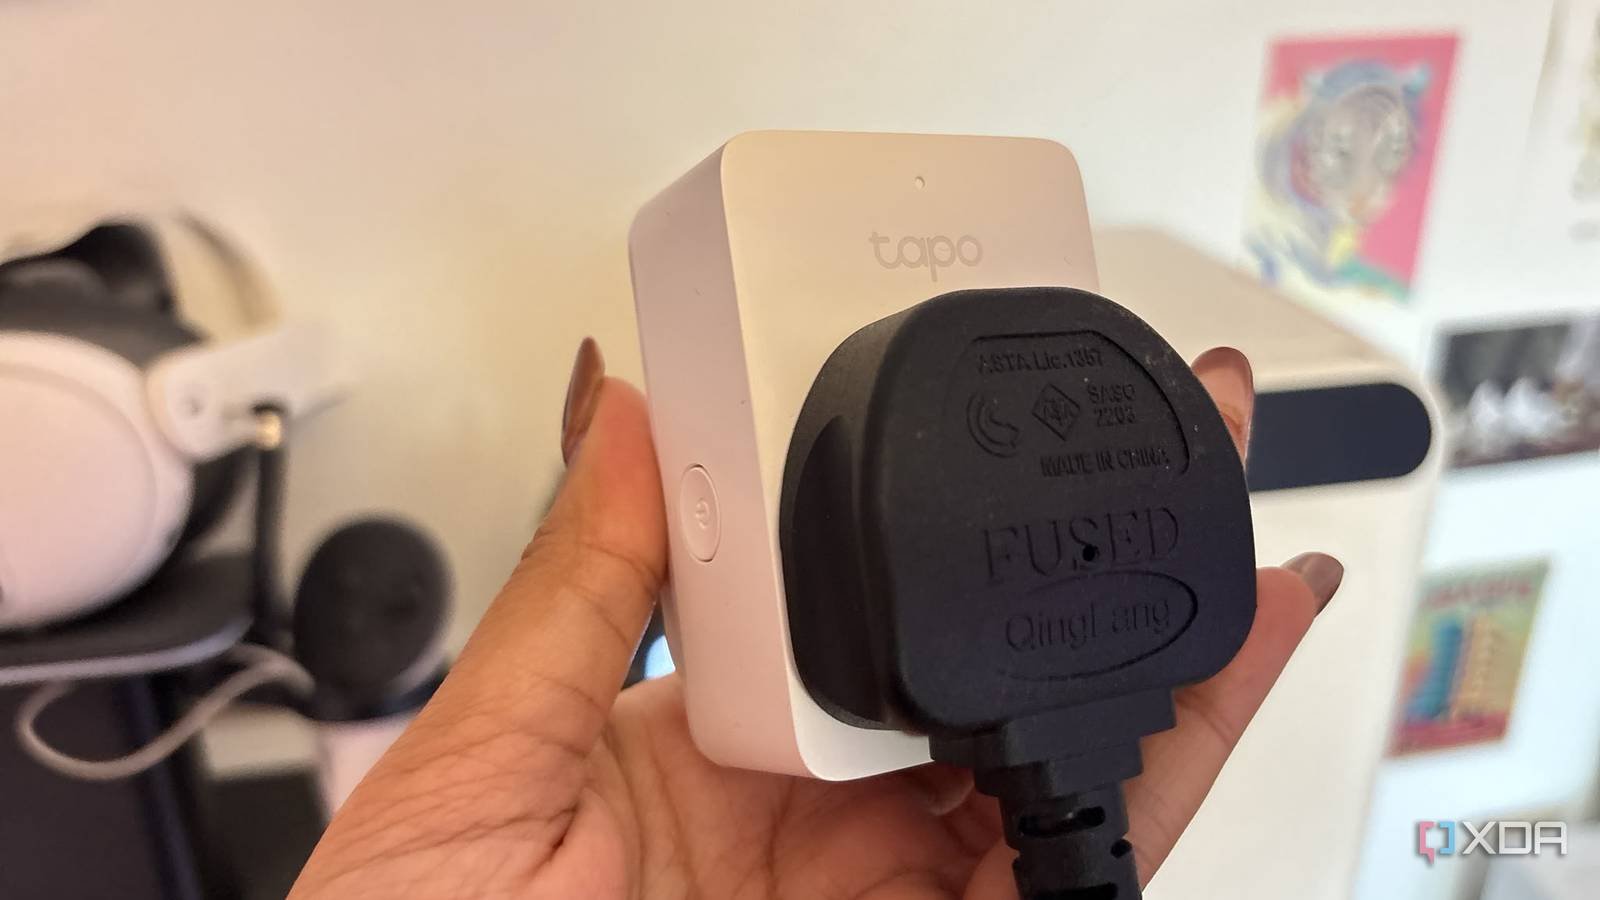
Published Nov 17, 2026, 10:00 AM EST Jasmine is Software and PC Hardware Author at XDA with years of tech reporting experience ranging from AI chatbots right down to gaming hardware, she's covered just about everything. Whether it's breaking news about the latest AMD NPUs or creating video tutorials on social media platforms, Jasmine has contributed to the world of AI and tech in a variety of ways including interviewing the CEO of Razer, AMD's Director of Product Marketing and the VP of Lenovo. Passionate about gaming and PC technology, she has built countless computers, keyboards and other peripherals - knowing them inside and out. Home lab enthusiasts often track CPU temperatures, RAM utilization, and disk I/O to the decimal, yet we rarely monitor actual wall socket power draw. I decided to place a Tapo P110 Smart Energy Monitoring Plug between the wall receptacle and my home lab's primary uninterruptible power supply. The P110 was perfect since it's inexpensive and has built-in active power metering and local API polling support without needing third-party firmware flashing, and it's compact. How much energy my home lab was consuming was a bit of a shock, not due to heavy compute bursts but down to how relentless 24/7 idle baselines can compound over the span of a week when you consider current electricity rates. The plug you invest in matters Some smart plugs may not stack up When considering which energy monitoring smart plug to invest in, I had to be careful here just because of how many devices I've got plugged in. The primary brain of my home lab runs off of a mini PC. I then have a multi-bay NAS as well as a separate smart home hub in the form of the UGREEN HomeAgent; I've also got a managed PoE switch. When you're picking up an energy monitoring smart plug, keep in mind that they have resistive ceilings and are rated for a specific amount of volts, hertz, and amps. Home labs can be very power-hungry, so you need to make sure whichever plug you're picking up can withstand the load you're going to put on it. The Tapo P110 met all of these requirements for me, but plugs can vary based on region, so be sure to double-check what applies to you. Keep in mind that under the National Electrical Code, or the NEC, a 15 A circuit or plug shouldn't sustain more than a 12 A load continuously due to the 80% continuous load rule. Even if you're plugging in a power strip, that doesn't increase that ceiling because it's still a single plug socket. My energy consumption was higher than expected Even at 90% idle, I was shocked Next, it came to the actual measuring. For me, I relied on the Tapo app's basic bar charts that you can find in the app itself. Another option is to also poll your smart plug locally over LAN via Home Assistant if your plug has these capabilities. This way, you'll be able to record real-time wattage, current draw, and cumulative kilowatt-hours at fine intervals. You also may have to account for your plug's own overhead. For my plug, the published power consumption specs sit at 1.64 W while the relay is active and 0.64 W in standby. The first thing I noticed from my findings is that my home lab was actually completely idle for roughly 90% of the week. My setup never enters a deep-sleep idle state since my HomeAgent is continuously writing/spinning drives as it acts as an NVR; I also have cameras that draw active PoE power 24/7. This led to me having an operational floor of around 62W and 80W, which averaged 72 W (or 12.1kWh over the span of seven days). When looking at all of the devices that I have as part of my home lab, I was able to break down how each device contributed to that baseline based on expected draw derived from published manufacturer specifications. The energy monitoring smart plug I used measured the consumption of all of the devices together, not each device individually — because all of my devices sat downstream of my smart plug (and taking active NVMe storage offline midweek would have ruined their continuous 7-day baseline), I didn't meter each device individually. I instead cross-referenced my wall telemetry against manufacturer power specs and independent wall meter benchmarks, making it clear where the draw I found is actually going. I use the GEEKOM IT13 mini PC, which would likely sit around 12 to 13W since I have active containers running on it. I also have the UGREEN DH2300 running two HDDs. It has a low-power ARM SoC, so the chassis itself only draws around 3W. The two spinning drives add roughly 3–4W each at rest, ticking up to 14–15W during active SMB transfers. This means in total it's likely pulling around 12W when idle. The UGREEN HomeAgent HA100 with two HDDs is likely pulling somewhere between 20W and 26W, as I only have two drives installed inside. It'd likely be higher than this if I were using all three drive slots. This is a higher draw than the other devices in my stack so far because its drives must spin and write continuously in order to ingest camera feeds since it acts as a 24/7 NVR. And lastly, my managed PoE switch, which powers two PoE cameras, is likely pulling somewhere around 25W. I did notice that every evening the total rack wattage steps up by around 4W as soon as the sun sets and then stays that way until sunrise. This is likely down to the fact that both PoE cameras engage their infrared night vision LEDs, holding that higher plateau all night long. But what was this actually costing me? Spoiler alert: a lot more than I thought It's all well and good having these statistics, but something I was more interested in, rather than just the energy consumption alone, is, of course, what this was looking like on my utility bill. After calculating my weekly consumption, I multiplied this by 52.14 weeks so I could get a yearly total, ending up with 12.1 kWh x 52.14 = 630.7 kWh. You can then multiply this by your utility rate to find out exactly how much it's costing you per the EIA's Electric Power Monthly table, which was released in October 2026 and covered August 2026 residential data. The United States national average residential electricity price is 18.16 cents per kWh, which is a 3.4% year-over-year increase. This would mean that my home lab is costing me $114.54 per year, or roughly $9.50 per month — a monthly subscription cost I would likely turn my nose up at. This can vary quite dramatically across different locations, even within the U.S. itself. That identical telemetry translates to very different annual bills in low-rate states like Louisiana, where the average is 12.87 cents per kWh, or North Dakota, where it comes in at 13.31 cents per kWh. This would make the exact same setup cost between $81 and $84 per year. There are high-rate states like California as well, where electricity comes in at around 29.75 cents per kWh on average, bringing the cost of my home lab up to $187.64, and it can even go as high as $297.57 per year in states like Hawaii, where the energy cost is 47.18 cents per kWh on average. Don't dismiss idle draw It can add up to vast amounts of cash It's easy to dismiss your home lab's power draw on a day-to-day basis because it feels so low, but add up the idle draw over the span of a year, and suddenly you could be spending hundreds of dollars just on electricity to keep your home lab alive. Even when you build smartly around ARM-based NAS boxes and an efficient mini PC instead of an enterprise rack, always-on networking, spinning disks, and PoE cameras can quietly add up to over 630 kWh a year. Tapo P110 The Tapo P110 comes with energy consumption control and is compatible with Alexa, Google Home, and voice control.
I plugged my whole home lab into a smart energy monitoring plug for a week, and the electric bill reality check shocked me
Full Article
Original Source
Read the full article at Xda-developers →KhanList aggregates and links to publicly available news content. We do not host full articles from third-party sources. Always verify important information with original sources.