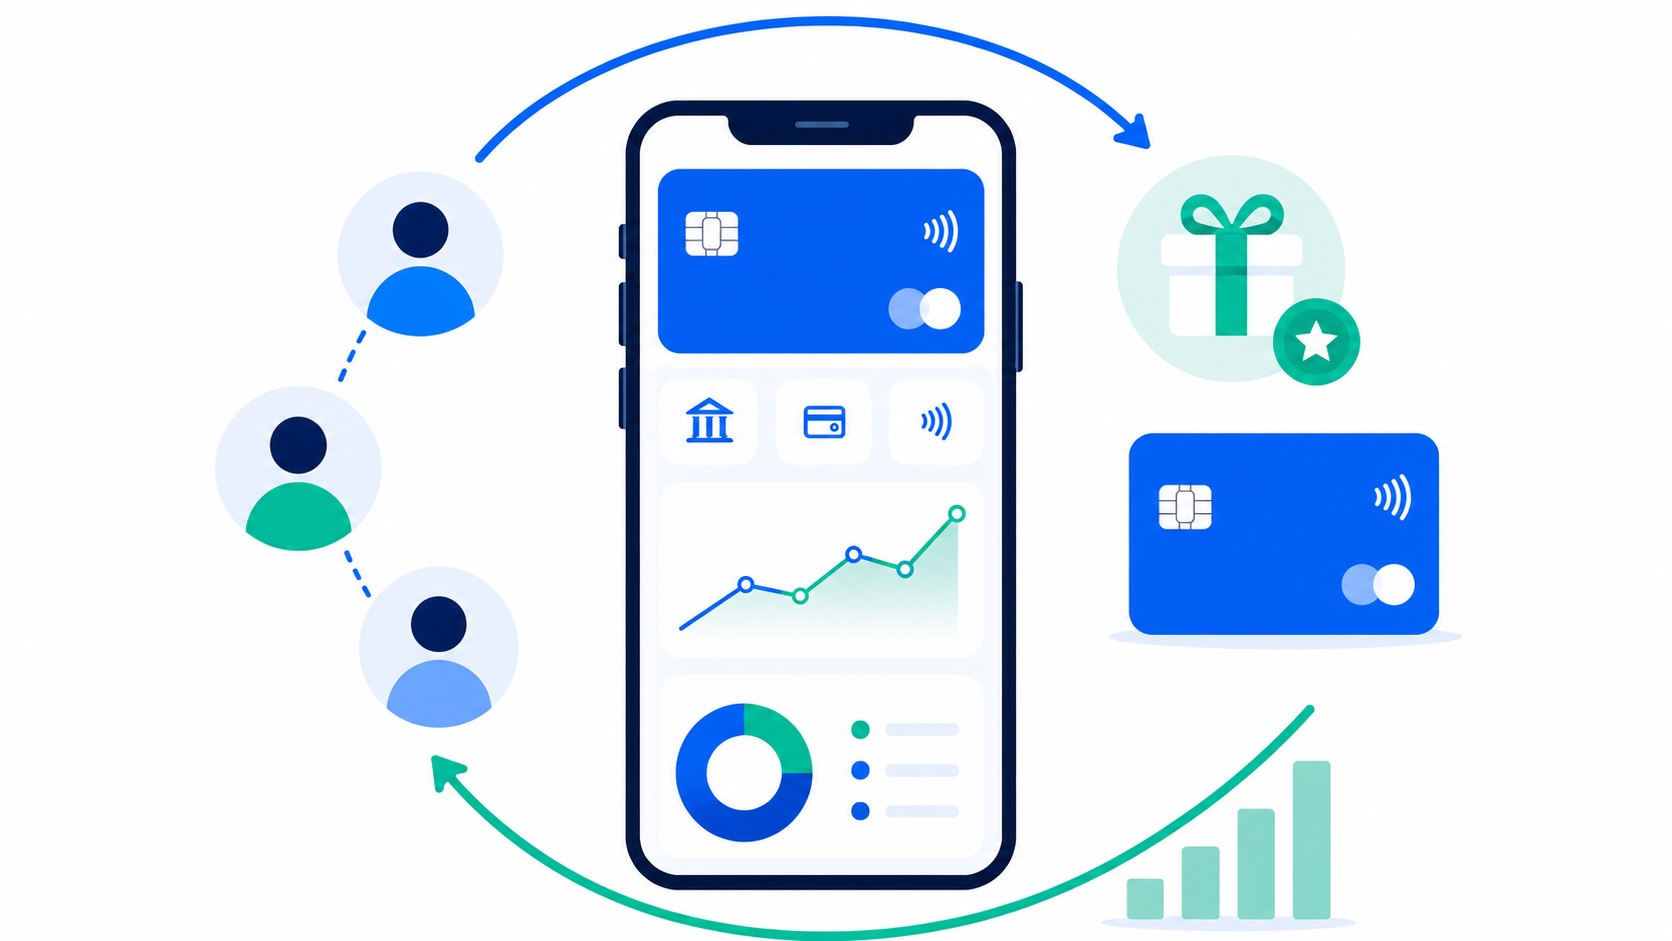
Introduction , there is a pattern that any growing team quickly learns: acquiring a new user, or bringing back a user who has already churned, is much harder and more expensive than retaining someone who is still using the product. In digital banking, this is especially visible because customer acquisition costs are high. User retention in fintech depends on many factors: service quality, product functionality, loyalty mechanics, communication, and other parts of the user experience. In this article, I will focus on one practical example: how ML-based personalization can help work with at-risk users and apply loyalty mechanics more precisely. The task had three steps. First, we needed to learn how to identify users who were likely to churn. Then we had to define the retention mechanic, meaning what exactly could bring the user’s interest back to the product. After that, we needed to optimize the intervention itself: to understand which users in the risk segment would actually be affected by the retention offer. In this article, I will share a practical guide to building an analytical system for this type of task. It is based on two ML models: a pre-churn model, which identifies users at risk, and an uplift model, which helps determine which of them are truly sensitive to a retention offer. I will explain the practical value of each stage: why it was needed from a product perspective, what problem it solved, and what conclusions we were able to draw from the research. Preparation: Target and Features Let’s start with the churn definition. I worked on the growth of a debit card product, where user behavior is best described through transactional activity. So we settled on a practical definition: churn means no card payments for 30 days. This definition is often used in financial products, and the logic behind it is fairly clear. If a person has not made a single transaction in a month, the card has effectively dropped out of their wallet. Formally, the account may still be open, but from a product perspective, the user is no longer active. Accordingly, the model target is a binary flag: whether the user made at least one payment within the next 30 days. Next, let’s move to feature collection. For this task, I collected several dozen features describing the client’s behavior in the service. I cannot disclose the exact production feature set, but I will share the main principles for building a feature representation of a client in a fintech product based on transactional activity and user profile data. User profile. Basic client characteristics: age, region, device type, connected products, tariff plan, subscriptions or loyalty program status, account status such as new user, active client, and so on. Activity aggregates over time windows. Behavioral metrics calculated over 7, 30, and 90 days: number of transactions, turnover, average transaction amount, number of unique spending categories, number of active days, and so on. Different windows help capture changes in user behavior. Time intervals. How much time has passed since the last or first payment, what the average gap between transactions was, and how the rhythm of activity changes over time. In practice, the signal that a user “has not appeared for a while” often turns out to be one of the strongest predictors of churn. Calendar features. Day of the week and month. Without these features, the model may confuse natural drops in activity with actual churn. Financial services are highly sensitive to seasonal patterns, so it is better to account for them upfront. Derived features. Ratios between time windows, shares of transactions of a certain type, normalized and relative metrics. These features help compare clients with different baseline levels of activity and avoid penalizing users who simply spend less. Pre-churn Model Let’s start with the pre-churn model. Our goal at this stage is to identify the segment of users for whom the existing loyalty mechanics are no longer working. In other words, users who are losing interest in the service under the current level of loyalty incentives. At this stage, the task is to identify users with an elevated risk of leaving. For this, we need a model that predicts the probability of a future payment. If the predicted probability is low, the user falls into the pre-churn segment. In that case, the service should pay attention to the user in advance, while churn can still be prevented. Training the baseline model The model is built on the collected features and predicts the probability of a payment over a 30-day horizon. Essentially, this is a binary classification task with probability estimation. User characteristics are passed as input, and the output is the probability that the user will make at least one payment within the next 30 days. p_base(x)=P(Y=1|X=x)p\_base(x) = P(Y = 1 | X = x) where Y ∈ {0, 1} indicates whether the user will make a payment within the next 30 days, and X denotes the matrix of user features. Many ML tools can be used for this type of task. In practice, gradient boosting models often deliver strong performance with a reasonable amount of analytical effort required for model training: XGBoost [1], LightGBM [2], and CatBoost [3]. Users can then be ranked by risk level. The lower the predicted probability of payment, the higher the risk of churn: risk_score(x)=1−p_base(x)risk\_score(x) = 1 – p\_base(x) A user enters the pre-churn segment if their predicted probability of payment is below a selected threshold t: S_prechurn={x:p_base(x)u}Target = \{x ∈ S\_prechurn : τ(x) > u\} where u is the minimum expected uplift at which it makes sense to show the offer to the user. ML-based retention system workflow. Image by the author, created with ChatGPT For ongoing operation of the system, we took into account that both models, the pre-churn model and the uplift model, would need to be recalibrated regularly. That means the system needed a constant flow of fresh experimental data. So we designed the offer distribution logic in a way that would generate this data continuously. Some users were excluded from the retention system entirely, meaning no retention mechanic was applied to them. This group showed the real churn level without intervention and served as a reference point for calibrating the pre-churn model. Within the pre-churn segment itself, there was another split: some users did not receive the offer, while others received it randomly, independently of the uplift model. This random offer allocation provided clean data on response to the intervention, which was then used to recalibrate the uplift model. Conclusion In the end, we built a complete machine learning-based retention system. It relies on two models. The first one, the pre-churn model, identifies users with a low probability of payment, meaning those who are already in the risk zone. The second one, the uplift model, looks inside this segment and finds customers who are actually likely to respond to a personalized offer, such as increased cashback. This combination solves two problems at once. On the one hand, we can see in advance who is losing interest in the service and react before the user actually leaves. On the other hand, the marketing budget is spent more precisely: offers are not sent to every user in the risk group, but only to those whose behavior is likely to be influenced by the intervention. As a result, the system helps not just retain customers, but do it in an economically meaningful way. The company spends less on users who would have stayed anyway and concentrates the budget where the retention intervention produces a real incremental effect. Sources [1] Tianqi Chen and Carlos Guestrin. XGBoost: A Scalable Tree Boosting System. Proc. 22nd ACM SIGKDD, 2016. https://xgboost.readthedocs.io/ [2] Microsoft Corporation. LightGBM Documentation, 2026. https://lightgbm.readthedocs.io/ [3] Yandex. CatBoost Documentation, 2026. https://catboost.ai/docs/en/ [4] Sören R. Künzel, Jasjeet S. Sekhon, Peter J. Bickel, and Bin Yu. Metalearners for Estimating Heterogeneous Treatment Effects Using Machine Learning. Proceedings of the National Academy of Sciences, 116(10), 2019. https://www.pnas.org/doi/10.1073/pnas.1804597116 [5] Van Calster et al. Tutorial on Calibration Measurements and Calibration Models for Clinical Prediction Models. JAMIA, 27(4), 621–633, 2020. https://academic.oup.com/jamia/article/27/4/621/5762806
How to Improve Customer Retention in FinTech
Full Article
Original Source
Read the full article at Towardsdatascience →KhanList aggregates and links to publicly available news content. We do not host full articles from third-party sources. Always verify important information with original sources.