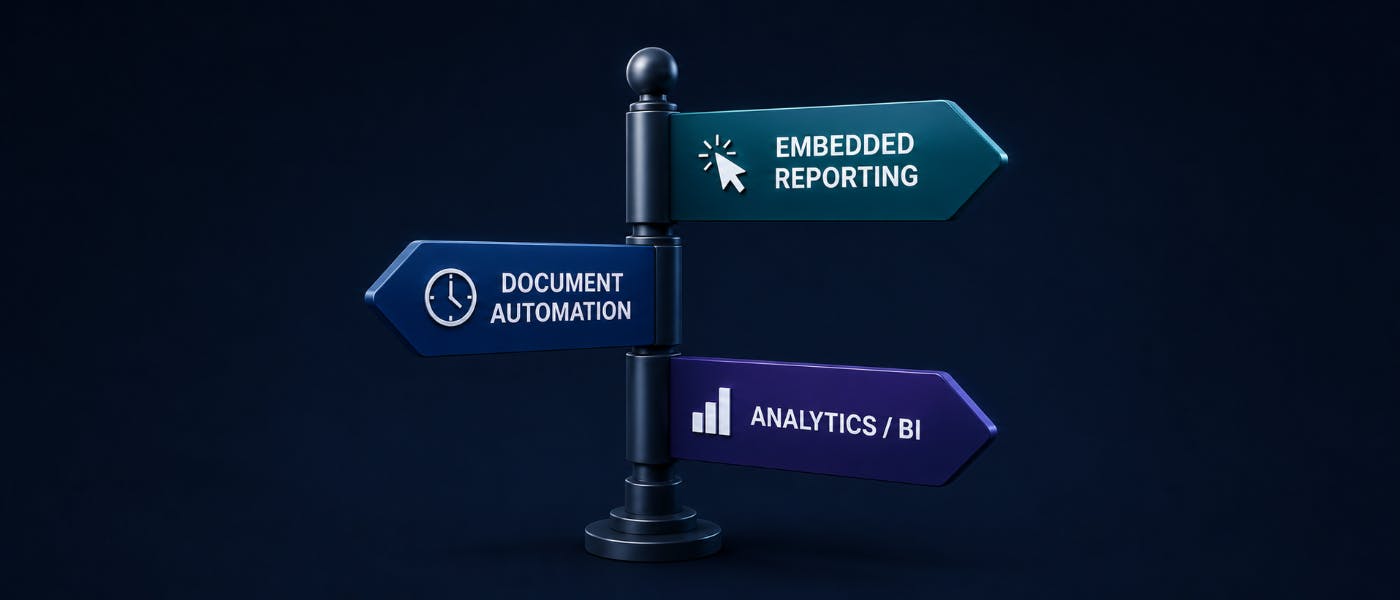
You’ve probably seen this before. Somewhere in your backlog there is a ticket that just says "We need reporting." There are no examples. No format. No mention of who triggers it or where the output goes. And over the next three sprints, that one line quietly mutates into charts, PDF invoices, Excel exports, a scheduled overnight job, and - surprise - a compliance format that wasn't considered during the planning stage.The problem is not the work itself. The problem is that “reporting” is one word for several very different jobs. In practice, teams often mean one of three categories: embedded reporting, document automation, or analytics platforms. Each comes with different tools, failure modes, and deployment concerns.Pick the wrong category early, and you may not notice right away. The first prototype might even work. But a few sprints later, the requirements start pulling your architecture in a direction it was never designed for.This guide is for developers building reporting into a .NET application. If your goal is to enable analysts to explore data in Power BI, Tableau, or Looker, those are excellent tools for a different purpose. Let's distinguish between the three categories before you dedicate a sprint to the wrong one.Category 1: Embedded reporting (the report lives in your app)This is what most developers mean when they say, "add reporting." The application generates a structured, formatted document from its own data on demand without the user ever leaving your UI. The user clicks export, print, or download PDF, and your business logic produces an invoice, an account statement, an audit export, or a customer-facing summary.The defining traits are structure and predictability. Layout is not decoration here. Fonts, column alignment, group totals, headers, footers, and page breaks all carry meaning. A PDF invoice that pushes the VAT total onto a second page isn’t a cosmetic glitch; it's a number that customers or auditors will question.Technically, this calls for a reporting engine with reliable cross-format rendering and, ideally, a designer that lets non-developers adjust layouts without a code change. This is not a BI platform that is added to your app with its own login and data model. Embedded reporting is tightly coupled to your domain data, permissions, and UX. That coupling is the point.Category 2: Document automation (the workflow generates the document)At first glance, document automation may seem similar to embedded reporting. You still work with templates. You still bind data into layouts. You still produce PDF, Word, Excel, and other structured outputs. But the important difference is not the output. Rather, it is who or what starts the process.Embedded reporting is usually user-initiated. A user opens a screen, selects a report, and clicks a button. Document automation, on the other hand, is system-triggered. It runs because an event happened, a schedule fired, or a backend process reached a specific state. This often occurs in bulk and with no human involvement.Typical workflows look like this:An order is placed → an invoice is generated and emailedA contract clears approval → a signed PDF is produced and archivedA nightly job runs → ten thousand statements land in a storage bucket before anyone logs inTemplates do the heavy lifting. You define a layout once, bind it to data, and run it at scale. Output formats also matter more, because these documents often need to be stored, edited, audited, or submitted to external systems. Depending on the market you sell into, you may need PDF/A for long-term retention, Word for downstream editing, or e-invoicing standards such as ZUGFeRD/Factur-X or XRechnung.The overlap with embedded reporting is real, and many reporting SDKs cover both. The useful distinction is the workload, not the tool name: interactive vs. automated, on-demand vs. scheduled, low-volume vs. high-volume.If your system needs both "a user clicks export" and "the backend produces 8,000 documents at 2 a.m.," you want one solution that handles both. Otherwise you end up maintaining a screen path, a PDF path, a batch path, and a compliance path that slowly drift out of sync over time.Category 3: Analytics platforms (the user explores the data)This is where teams most often pick the wrong box. Power BI, Tableau, Looker and the like are built for exploring data across systems. This includes dashboards, ad hoc queries, trend discovery, and decision support.These are valuable tasks, but they are not the same as generating application documents. Analytics shines on questions like:Why did revenue dip this quarter?Which segment is growing?How do sales and support data correlate?These are analytical problems. But “generate this invoice,” “export this filtered list,” or “produce this compliance document” are workflow problems. They need a different architecture.Even embedded BI tends to bring its own authentication, semantic model, and authoring environment. That is perfectly fine when the goal is analytics. However, it is a poor fit when the goal is application-native document generation that has to respect your tenant boundaries, roles and business logic.Mature systems often use both: embedded reporting for invoices, statements, and compliance docs, and BI platforms for executive dashboards and internal analysis. That’s not duplication. It’s separation of concerns.A quick decision filterWhen the boundary blurs, these questions usually settle it:Who generates the output?App logic, events, or schedules → embedded reporting or document automation.A user building a view → BI.Does it have to survive export?Must look correct as a PDF, print, archive, or e-invoice → embedded reporting / document automation.Stays interactive on screen → analytics.Does layout precision matter?Fonts, totals, page breaks, group integrity → embedded reporting.Fluid and exploratory → BI.Do users customize layouts inside your product?Yes → embedded reporting.In a separate environment → BI.Must it honor your permission model?Tenant boundaries, roles, row-level access enforced in the report itself → embedded reporting or document automationRequirementCategoryBackend generates 10,000 invoices overnightDocument automationCustomer downloads an account statementEmbedded reportingDocument created after workflow approvalDocument automationExecutives view cross-system dashboardsAnalytics / BIFinance explores revenue trendsAnalytics / BIPDF/A or E-Invoicing/ZUGFeRD output is mandatedEmbedded reporting or document automationUser clicks "Export PDF" in-appEmbedded reportingUsers adjust report layouts inside the appEmbedded reportingWhere List & Label fitsOnce you determine whether you need embedded reporting or document automation rather than analytics, it becomes much clearer which tool to use.List & Label sits in that category as an embedded reporting SDK, not a BI platform. It’s designed to integrate into .NET Applications, working with their data, workflows, and output requirements. For interactive scenarios, the embeddable designer allows developers to define available data sources, fields, and boundaries while end users adjust layouts within those limits. That keeps routine formatting changes out of the engineering backlog without handing users raw data access.On the automation side, it targets server-side and backend stacks across web, cloud, desktop, and cross-platform .NET (Blazor, MAUI, ASP.NET Core, Avalonia, Docker, microservices). And because reporting and automation overlap at the compliance boundary, combit states that List & Label supports ZUGFeRD/Factur-X and XRechnung. It emits PDFs with embedded structured XML, which are necessary for E-Invoices.What it doesn’t try to be is a BI platform. If you need cross-system analytics or self-service dashboards, Power BI or Tableau remain the better call. But if the goal is generating reports and documents inside your .NET App with control over layout, output, data access, and integration, an embedded reporting SDK is the category that fits.You can explore List & Label here:The takeawayMost reporting projects aren't difficult because of technology. They’re hard because the requirements were never defined. First, separate the three categories: embedded reporting for structured in-app documents, document automation for programmatic bulk generation, and analytics for exploration. This way, tool selection stops being a guessing game. A reporting tool like List & Label can usually cover the first two categories, while a BI platform covers the third. The most expensive mistake is buying one tool and expecting it to behave like another.
How to Choose the Right Reporting Architecture for a .NET Application
Full Article
Original Source
Read the full article at Hackernoon →KhanList aggregates and links to publicly available news content. We do not host full articles from third-party sources. Always verify important information with original sources.