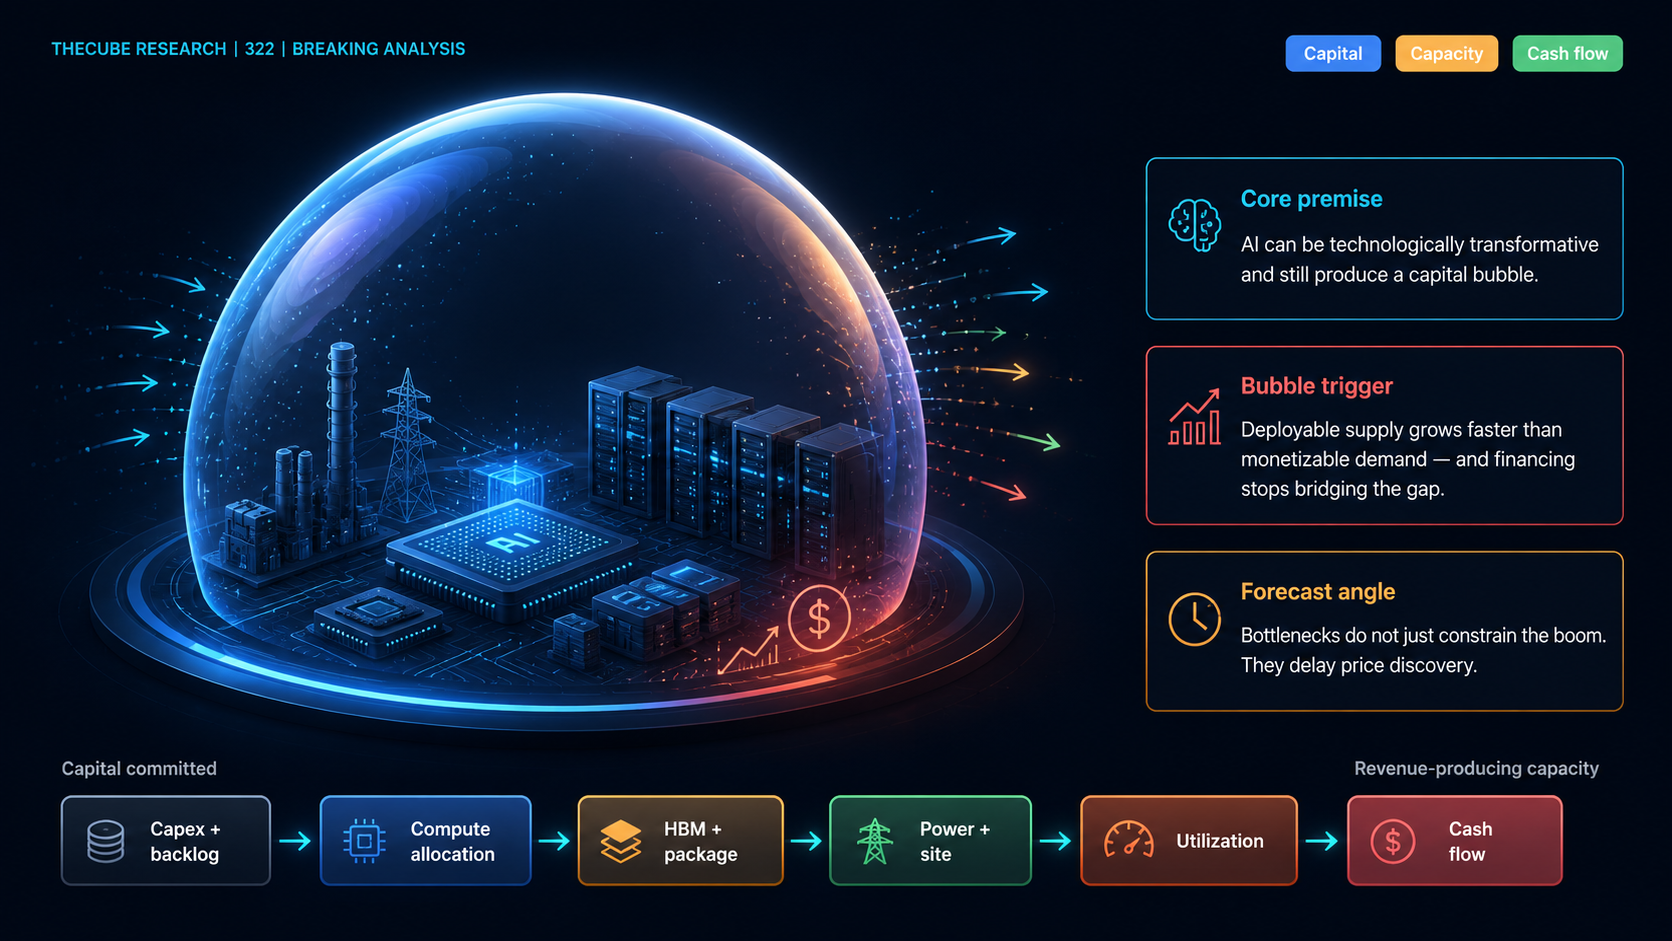
Forecasting the AI bubble: When scarcity turns to surplus AI can be technologically transformative and still produce a capital bubble. Those two ideas are not in conflict. The bubble bursting does not require AI to fail. It only requires deployable supply and capital commitments to grow faster than monetizable demand. When productive, revenue-producing AI capacity takes longer to materialize, pricing will normalize and financing will no longer bridge the gap. That’s when the capital cycle resets. But here is the good news for investors. The AI supply chain remains constrained by high-bandwidth memory, advanced packaging, network fabric, power and site readiness. These bottlenecks not only slow deployment, they also delay price discovery (i.e. the point at which buyers have more choice); and they postpone the moment when the market discovers whether it has overbuilt. Welcome to this week’s Breaking Analysis. We’ve titled it: “Forecasting the AI Bubble: When Scarcity Turns to Surplus.” In this episode, we will build a framework for understanding what could delay the bubble popping, what could trigger it and which indicators will reveal when scarcity in supply becomes surplus that impacts the market. We will also test that framework against the Oracle, OpenAI and Stargate buildout, which to us is the clearest current example of capital commitments racing ahead of deployment, utilization and cash flow. Our premise today is the following: The bubble will not burst because AI stops working. It pops if scarcity clears before utilization and cash flow catch up. And the best place to begin is with the number that makes this cycle look almost unstoppable: A projected $1.5 trillion semiconductor market Let’s begin with the sheer scale of the demand picture. In 2024, David Floyer and I forecast that an expanded silicon ecosystem would approach $1T by 2028. The scope of that model was broader than the WSTS semiconductor-product market shown here, so this is not a perfect apples-to-apples comparison. But directionally, the market is moving much faster than we anticipated. Global semiconductor revenue approached $800 billion in 2025. The WSTS forecast shown here puts 2026 revenue at approximately $1.51 trillion – nearly double in one year. So it’s clear that the underlying AI demand is substantial. Nvidia reported $75.2 billion of data-center revenue in its latest fiscal quarter, Broadcom reported $10.8 billion of AI semiconductor revenue, and AMD generated $5.8 billion in data-center revenue. Those are substantive proof points that AI-factory deployment and customer spending is unusually strong. But the composition of the forecast is where it gets interesting. More than half of the projected 2026 market comes from memory. So the revenue curve is being driven by two forces at once: Enormous structural AI demand and extraordinary scarcity pricing. That does not minimize the demand picture. It means the revenue line is rising faster than the physical unit and deployment curves. And that is where the bubble analysis begins. There’s little question that strong AI demand exists. The question is whether demand will continue absorbing capacity as HBM, packaging and other constraints ease – and as scarcity premiums begin to normalize. That is why we need to understand two separate memory curves: Physical bit growth, and the price and margin curve. A decline in memory pricing alone would not mean the AI bubble has burst. The more concerning indicator would be prices falling while physical bit demand, deployment and productive monetization also begin to weaken. To understand when that could happen, we have to understand why the supply constraints are not clearing simultaneously. The bottleneck moves across the system. The AI bubble has a bottleneck clock To forecast when scarcity could flip and become a surplus, we have to understand why the breaking point is likely to be delayed. AI infrastructure is not one market. It is a chain of interdependent gates as shown here. A GPU allocation without sufficient high-bandwidth memory is not deployable capacity. HBM without advanced packaging does not become a working accelerator. Racks require network fabric to operate as a cluster. And a cluster still requires power, a ready site and capital before it becomes revenue-producing capacity. The least available layer governs the output of the entire system. But the key point is that the binding constraint moves. Early in the cycle, the dominant shortage was accelerator availability. It then shifted toward HBM and advanced packaging. As those constraints ease, the pressure moves outward toward networking, power, site readiness and financing. Solving one bottleneck often reveals the next one. That does two things. First, it rations the amount of capacity that can actually reach the market. Second, it postpones the market-clearing test – i.e. the moment when we discover how much capacity customers will really consume, and what they will pay, once supply is broadly available. That’s what we mean by “price discovery.” David Floyer’s Volume–Value–Velocity framework gives us a useful absorption test. Additional volume is healthy when the technology creates enough value, and adoption moves quickly enough to absorb that capacity. But when system volume expands faster than useful demand and productive utilization, capacity turns into surplus. So the forecasting question is not only: When will more GPUs or memory ship? It is: When will the full system be capable of delivering more revenue-producing capacity than monetizable demand can absorb? And the first potential release valves in that system are memory and advanced packaging. Memory and packaging are the first release valves The bottleneck clock gives us a reasonable place to look for the first signs that scarcity is turning into surplus, which leads us to memory and advanced packaging. On the left, Micron’s fiscal third-quarter results show why the revenue reports can be misleading. Specifically, DRAM bit shipments increased by only a low-single-digit percentage sequentially. But the average selling price per bit increased in the low-60s percentage range. Those are two very different signals. The first tells us how much additional physical memory Micron shipped. The second tells us how much more the market paid for each unit of that capacity. In other words, the surge in DRAM revenue was overwhelmingly driven by pricing and product mix – not by Micron shipping anything close to 60% more memory. That does not mean AI demand is weak. It means scarcity is doing most of the work in the reported revenue line. The bubble test is what happens as additional supply becomes available. If memory pricing normalizes while physical bit demand and productive utilization continue to accelerate, that is potentially healthy. The market would be transitioning from a price-led cycle to a volume-led cycle. But if ASPs fall and bit growth also stalls, that is a more dangerous event. It suggests surplus is arriving faster than useful demand can absorb it. Now let’s look at the right side. Additional HBM supply does not automatically become deployable AI capacity. The memory has to be qualified, vertically stacked and integrated with the accelerator through increasingly complex advanced packaging – at acceptable yields. A memory stack sitting in inventory is not productive capacity. It only becomes productive when it is packaged with the accelerator, installed in a working system and ultimately used for revenue-producing workloads. So we need to watch four variables together: Bit shipments; Average selling prices (ASPs); Package lead times; and Package yield. When memory pricing and package lead times normalize together, the bottleneck will likely move downstream. But even then, assembled capacity does not earn a dollar until it reaches a powered site and gets put to productive use. That brings us to the two clocks governing the AI buildout. Capital can be committed years before capacity earns a dollar Memory and packaging tell us how much accelerator capacity can be assembled. This next slide asks the next question: When does that assembled capacity actually become economically productive? AI factories operate on two very different clocks. On the left is the short-cycle IT clock. That includes GPUs, custom accelerators and CPUs; HBM and server DRAM; networking and optics; and the servers and storage required to create a working computing system. These assets move comparatively quickly. They can be ordered, manufactured and delivered within quarters. And they are refreshed on a roughly three-to-six-year technology and economic cycle as new architectures improve performance, power efficiency and cost per useful output. This is the clock most visible in semiconductor bookings, supplier revenue and near-term guidance. But the right side operates on a much slower clock. The long-cycle site clock includes land and buildings, substations and grid interconnection, generation, cooling, water and the reusable physical infrastructure that may remain in service for decades. A new GPU can be designed and delivered in a few years with a cadence for follow-on products coming every 12-18 months. Meanwhile, a transmission line, substation and grid connection takes a decade to work through permitting and construction, with no follow-on sequence comparable to a GPU roadmap. A data-center building can be physically complete while it is still waiting for transformers, switchgear, cooling infrastructure or usable power. And that means the two clocks can move out of sync. Capital can be committed. Hardware can be allocated. Suppliers can report strong orders and revenue. But the capacity still has to be installed, accepted, energized and placed into productive use before it generates sustainable revenue and cash flow. By productive utilization, we mean more than whether the GPUs are turned on and the share of energized capacity running useful, revenue-producing workloads is throwing off sufficient volume, pricing and margin to recoup the capital invested. That timing gap is where bubble risk accumulates in our analysis. Many folks are hyper-focused on the risk that the industry is spending too much money. That’s not what concerns us. It’s more the risk that commitments, hardware deliveries and supplier revenue run ahead of the capacity that can be energized, productively utilized and converted into cash. So the takeaway from the slide above is: The short clock creates the appearance of rapid deployment. The long clock determines when that deployment actually becomes economic capacity. And the clearest real-world example of this mismatch is the relationship among Oracle, OpenAI and Stargate. Oracle, OpenAI and Stargate expose the commitment-to-deployment gap Here we show a concrete example. And it is important to understand that Oracle, OpenAI and Stargate are not three separate pools of demand that we should add together. They are one connected capital project, viewed from the buyer, supplier and physical-infrastructure perspectives. OpenAI reportedly committed $300 billion over five years to purchase compute capacity from Oracle, with the contract beginning in 2027 as part of the broader Stargate buildout. That is an extraordinary demand commitment. On Oracle’s side, that commitment is already showing up in capital spending, backlog and financing requirements. Oracle spent $55.7 billion in fiscal 2026 capex, up 162%, and has guided fiscal 2027 spending as high as $95 billion gross – or roughly $70 billion net as some customer monetization is showing up. At the same time, Oracle’s remaining performance obligations reached $638 billion. But RPO is not deployed capacity, and it is not current revenue. Oracle expects only about 12% of that RPO to convert into revenue during the next twelve months. Much of the rest is scheduled across the following three to five years. That is not, by itself, evidence that the contracts are weak. It is evidence that the spending and financing arrive substantially before the revenue. The same gap appears from OpenAI’s side. OpenAI’s total forward compute commitments are estimated at roughly $600 billion to $665 billion through 2030 – many times its current annualized revenue – while the company is still reporting substantial cash burn. So one side is committing to purchase enormous amounts of future capacity. The other side is spending and borrowing today to construct it. And physically, that capacity must still move through site construction, power, energization, customer acceptance and productive utilization before it produces any sustainable cash flow. Oracle’s free cash flow illustrates the concern. It moved from approximately positive $26 billion in fiscal 2025 to negative $24 billion in fiscal 2026, while debt increased and Oracle’s credit rating moved to the edge of investment grade. Again, this does not prove that Stargate fails. It shows where the risk accumulates. Commitments prove intent. They do not yet prove deployment, productive utilization or return on capital. The bubble risk lives in the time – and the financing – between those two conditions. And this example tells us exactly what to watch: Does demand convert into accepted, highly utilized, cash-generating capacity before scarcity resolves and financing becomes less available? That is the commitment-to-deployment gap we’re highlighting in this Breaking Analysis. Two wildcards can change the bubble clock Intel and China are relevant to this bubble framework for opposite reasons. Intel can extend the capital cycle. China can accelerate the market-clearing test. Let’s begin with Intel. Our earlier and well-documented concerns with Intel were never that Intel would become irrelevant. It was that a leading-edge foundry without substantial external wafer volume could not achieve TSMC-like learning curves, utilization or merchant economics. And if Pat Gelsigner’s plan were allowed to continue without a restructuring of costs, the company would go bankrupt. And the probability of the Intel board allowing that was near zero. With Lip Bu Tan cutting more than 20,000 jobs, the U.S. government’s stake, Nvidia’s investment and those of others like Softbank, that view now needs to be updated – but not reversed. Policy capital, strategic investors, product recovery and visible 18A learning have reduced Intel’s near-term failure risk and made the company a more important U.S. capacity option. But the commercial proof point has not yet arrived. The vast majority of Intel Foundry volume remains captive. The Nvidia relationship is strategically important, but it does not validate external wafer volume. The decisive milestone in our view remains a named external 14A anchor customer with committed wafer volume and credible ramp economics. Until that occurs, Intel is able to prolong the capacity buildout – and its associated capital intensity – before merchant economics are proven. But the risks remain until we see more proof. China works on the other side of the clock. Its progress is segmented, but mature-node manufacturing, NAND and commodity DRAM capacity are becoming meaningful. Open models and domestic platforms can also raise local utilization and accelerate ecosystem learning. China still has major gaps in high-yield HBM/HBM4, EUV, advanced packaging and power efficiency. But in our scenario, China does not need full frontier parity to affect the cycle. Enough memory and mature-node supply can pressure global pricing before those frontier gaps close. And rising domestic AI utilization can reduce the accessible market for Western suppliers. So the bubble implication is asymmetric: Intel may delay the break by prolonging policy-backed capacity formation. China may pull the market-event forward by accelerating supply and price normalization. Neither variable is simply bullish or bearish. That is why the next slide resolves the outlook through scenarios rather than one smooth CAGR for the semiconductor value chain. Three ways the AI capital cycle resolves Intel and China do not map neatly into a single bullish or bearish outcome. That is why we believe the AI capital cycle should be expressed through three possible resolutions – not one single metric of market growth. Below we show our scenarios. The first is a soft landing. In this scenario, demand absorbs the capacity being built. Inference creates a second major volume curve (similar to what occurred with reasoning and agentic), productive monetization remains high and enterprise ROI becomes increasingly measurable. In this scenario, memory prices normalize gradually rather than collapsing. Additional compute is consumed as it becomes available, and the primary constraint moves outward toward power, sites and energization. The second scenario – which is our base case – is a delayed reckoning. HBM, advanced packaging, network fabric and power remain constrained. The bottleneck continues to rotate rather than disappear. Scarcity premiums persist, capital commitments remain ahead of physical deployment and the market-clearing event is deferred. This scenario will likely sustain the boom for longer (through 2027 or possibly longer). But it can also allow the gap between committed capital and cash-producing capacity to grow. The third scenario is the bubble break. Here, the scarcity event clears before cash flow catches up. In this scenario, memory and packaging supply expand. Lead times normalize. Memory ASPs and GPU rental prices fall. Backlog conversion slows, productive monetization weakens and customers become less willing to prepay for future capacity. At the same time, debt, equity and third-party financing become less willing to bridge the gap. Importantly, AI does not have to fail for this scenario to occur. The bubble pops when deployable capacity begins growing faster than profitable utilization – and capital stops financing the difference. The transition among these scenarios is observable. So the final question is not which outcome sounds most compelling. It is: what indicators tell us that capacity is being absorbed – and what indicators warn that scarcity is turning into surplus? Watch conversion, not announcements Let’s close with the early-warning dashboard shown here. The bubble question is not how many GPUs are announced, how many campuses are planned or how much backlog is reported.The question is whether those commitments move all the way through deployment, energization, productive utilization and cash flow. The first sign is HBM bit growth versus average selling price. The healthy outcome is that physical bit demand accelerates while pricing normalizes gradually. That would suggest the market is moving from scarcity-driven revenue to sustainable, volume-led growth. The warning signal is that memory prices fall while physical bit growth also stalls. In that case, the industry loses both its scarcity premium and the underlying volume engine. Second, watch advanced-package capacity, lead times and yield. Additional supply is constructive when yields improve and the new capacity remains highly utilized – again meaning profitably monetized. The warning is that lead times collapse and package capacity arrives into weaker demand. That would indicate the first major physical bottleneck is clearing faster than the market can absorb it. Third, watch GPU rental pricing and productive cluster utilization. Pricing can moderate without being bearish if utilization remains high. Cheaper compute paired with rising consumption could expand the market as Jevons paradox kicks in. The more dangerous combination is rental prices and utilization falling together. That would be the clearest signal that deployable compute supply is beginning to exceed profitable demand. Fourth, compare energized megawatts with announced capacity. A site or rack waiting for power is a deployment problem. A powered site that remains underused is a demand and monetization problem. The healthy outcome is that energized capacity converts rapidly into revenue-bearing workloads. Finally, watch backlog, customer prepayments and free cash flow. Contracts have to become accepted capacity, recognized revenue and operating cash flow. The warning signs are slower acceptance, weakening prepayments and rising dependence on debt or equity to sustain the buildout. There are signs that the debt and equity warning sign is flashing today, but capital appears to be unconstrained, for now. Taken together, these five indicators separate our three scenarios. If new capacity is absorbed, the soft-landing case strengthens; If the signals remain mixed, rotating bottlenecks continue to delay the day of reckoning; But if pricing, productive utilization and financing weaken together, scarcity is turning into surplus. So the action item is straightforward: Track the entire conversion chain – commitment, deployment, energization, productive utilization and cash flow. The bubble breaks when scarcity resolves before productive utilization and cash flow catch up. So, when does the bubble pop? Here’s our best assessment of the timing and risk levels of supply resolving ahead of productive monetization. We would peg 2029 as the high risk year as it’s likely that enough supply will be deployable to expose a pricing equilibrium – i.e. the bottlenecks will largely be resolved, China capacity will be significantly higher and Intel will be a viable second source to TSCM. Power delays could absolutely push this into the 2030s. Our highest-risk window is 2028 through 2029, with 2029 the most likely year for a broad capital-cycle break. We expect the first cracks to appear earlier – but the bubble itself becomes visible only when enough memory, packaging and energized capacity reach the market to test whether productive demand can absorb them. If we were forced to put a timeframe on when scarcity might resolve ahead of productive utilization it’s 2029. But that doesn’t mean we won’t have a soft landing. Let’s hope if and when the bubble bursts, and it very likely will if history is an indicator, enterprises have broadly figured out the monetization equation and the pop will be less dramatic than other black swan events. Perhaps that’s wishful thinking… A message from John Furrier, co-founder of SiliconANGLE: Support our mission to keep content open and free by engaging with theCUBE community. Join theCUBE’s Alumni Trust Network, where technology leaders connect, share intelligence and create opportunities. 15M+ viewers of theCUBE videos, powering conversations across AI, cloud, cybersecurity and more 11.4k+ theCUBE alumni — Connect with more than 11,400 tech and business leaders shaping the future through a unique trusted-based network. Are you AWS customer? Support SiliconANGLE Financially by buying your AWS services from our Marketplace portal page and links. About SiliconANGLE Media SiliconANGLE Media is a recognized leader in digital media innovation, uniting breakthrough technology, strategic insights and real-time audience engagement. As the parent company of SiliconANGLE, theCUBE Network, theCUBE Research, CUBE365, theCUBE AI and theCUBE SuperStudios — with flagship locations in Silicon Valley and the New York Stock Exchange — SiliconANGLE Media operates at the intersection of media, technology and AI. Founded by tech visionaries John Furrier and Dave Vellante, SiliconANGLE Media has built a dynamic ecosystem of industry-leading digital media brands that reach 15+ million elite tech professionals. Our new proprietary theCUBE AI Video Cloud is breaking ground in audience interaction, leveraging theCUBEai.com neural network to help technology companies make data-driven decisions and stay at the forefront of industry conversations.
Forecasting the AI bubble: When scarcity turns to surplus
Full Article
Original Source
Read the full article at Siliconangle →KhanList aggregates and links to publicly available news content. We do not host full articles from third-party sources. Always verify important information with original sources.