
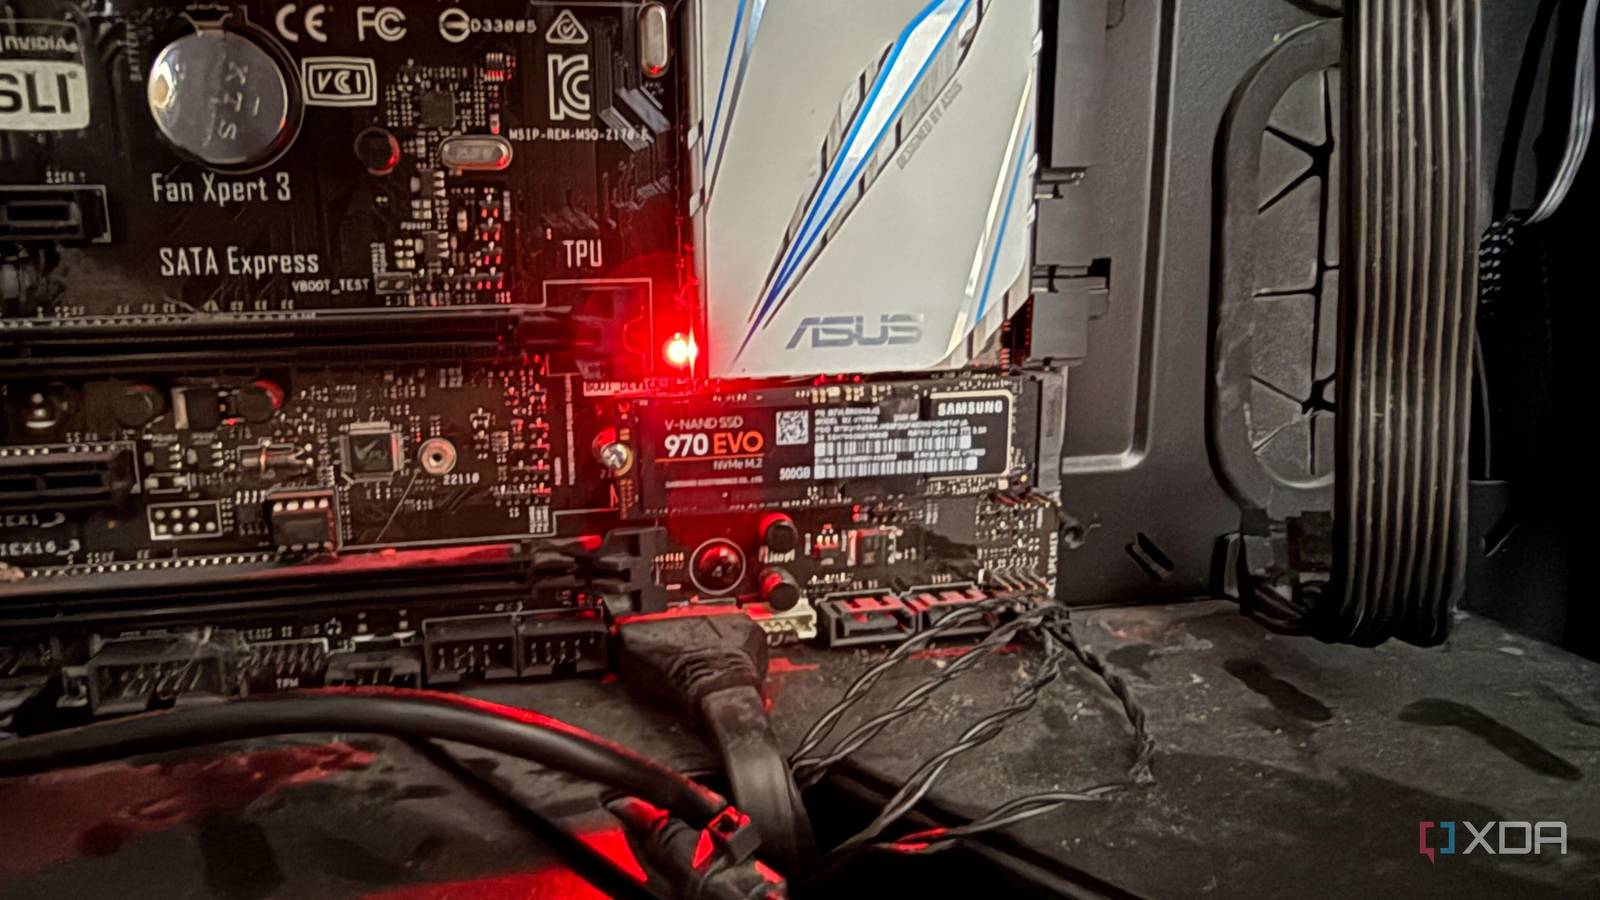
Published Sep 16, 2026, 7:00 AM EDT His love of PCs and their components was born out of trying to squeeze every ounce of performance out of the family computer. Tinkering with his own build at age 10 turned into building PCs for friends and family, fostering a passion that would ultimately take shape as a career path. Besides being the first call for tech support for those close to him, Ty is a computer science student, with his focus being cloud computing and networking. He also competed in semi-pro Counter-Strike for 8 years, making him intimately familiar with everything to do with peripherals. My Proxmox host uses a 500 GB NVMe SSD as its boot drive, and to be honest, while that capacity is on the smaller side for a modern boot drive, it's overkill for a machine like this. Proxmox itself takes up a few gigs, container templates and ISOs take up a bit more, and then every actual byte of data that I care about lives on the ZFS mirror that's stored on two SAS drives off of an HBA card. Despite being rarely called upon to do any actual work, that boot drive is constantly being written to in the background by Proxmox, and it eats into the drive's TBW. Most people have no idea, and it can have a very real effect on the lifespan of your SSD. The config filesystem never stops pmxcfs is the first source of writes Proxmox's filesystem works a bit differently to a normal Debian one, and there's some key differences that add some background writes which are virtually invisible unless you go looking for them. The /etc/pve directory looks like a normal part of the filesystem, but it's actually a FUSE mount backed by an SQLite database, along with a write-ahead log. Every single guest configuration, storage definition, and cluster state, pass through that database, so the writes can add up pretty fast, especially if you have a handful of nodes. It makes sense in a cluster because you have multiple nodes that need to be kept in sync, but this writing still happens on a standalone node. It used to be a lot worse, too: a PVE 5.0 user found that it could write 10KB at 10 writes per second, while config.db barely changed, and by their estimate, this added up to several hundred gigs in a matter of a year. Now, the way pmxcfs works is a little more conservative, but it can still rack up writes. The FUSE library used to be limited to 4KB writes, but Proxmox raised that ceiling to 128KB in a change that shipped with PVE 8.3, listed in the release notes as reducing amplification in the cluster filesystem. The developer benchmarks quoted in the patch put the improvement at roughly 15x down to 11x amplification for an 8KiB write, and roughly 360x down to 15x for a one-megabyte write. There are a couple of other streams, too Metrics daemon also writes more than it really needs to Aside from those writes, pvestatd polls node and guest stats roughly every ten seconds or so, and it feeds further writes to your drive in another database. These are tiny writes to dozens of files, which again, add up quickly. In PVE 9, this mechanism in particular got heavier rather than lighter, and that's thanks to a smaller aggregation window that retains more of these data points per archive. This helps with graph resolution, but also results in measurably higher CPU and disk load. ZFS compounds this even further Not a good time for your drive Everything discussed so far is completely agnostic to filesystem, but if you chose ZFS for your root, you're compounding these writes even further. ZFS is copy-on-write, so every time a write takes place, its metadata and checksums get rewritten for that block. The default ashift value 12 means that a database of a few hundred bytes still costs a full 4KB. If you were to mirror your boot pool in addition to this, you're doubling it all again. Not good for a QLC drive. Your drive is still probably fine It's not nothing, but it's not an immediate concern Measured properly, with the pmxcfs backend isolated onto its own loop device, on a freshly installed, idle, guest-free single node, produces around a thousand sectors per minute, which is around half a terabyte a year, roughly. My 970 EVO is rated at 300 terabytes written, so even when generously multiplied by everything else on the node, the endurance ceiling is decades away. And the reason why these small writes exist is because of what Proxmox is—an enterprise platform. These writes are usually being performed on enterprise SSDs that are rated for a much higher TBW number than my 970 EVO. To check and see where your drive currently stands, you can run smartctl and note the Data Units Written. Wait a day, then run it again and check and see how much it's moved. If your node is standalone and the number is genuinely concerning to you, you can turn off the HA services. After that, set a cap or make journald volatile and set the guest storage to stay off of the boot pool. Proxmox can rip through a boot drive if you're not watchful This isn't an unintended effect of running Proxmox, and it's actually one of the things that makes it better suited for a real production environment within the enterprise space. With that said, if you're running it at home, these writes can accumulate pretty quickly on a consumer drive, and if that drive is a QLC SSD, you might want to make sure it's not going unchecked.
Your Proxmox boot drive is probably dying faster than you think — here's what's actually happening
Full Article
Original Source
Read the full article at Xda-developers →KhanList aggregates and links to publicly available news content. We do not host full articles from third-party sources. Always verify important information with original sources.