
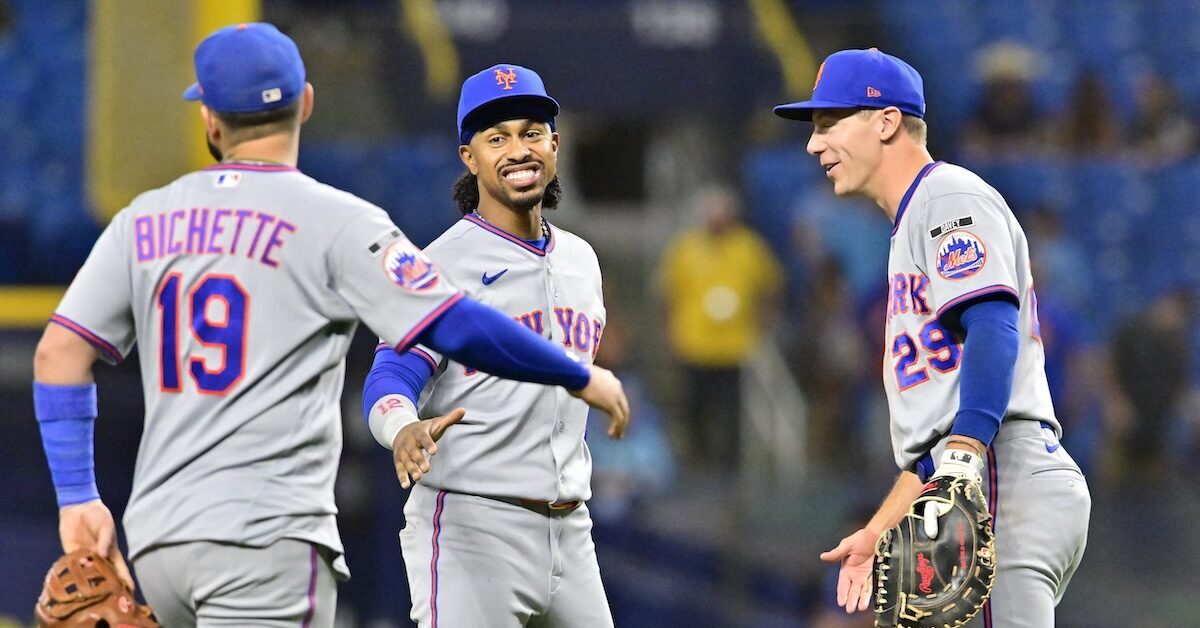
Pablo Robles-Imagn Images Baseball fans are often unhappy with projections, and they seem to enjoy sharing that unhappiness with me. That’s hardly surprising, of course — projections have large error bars (which we try to express when discussing them), and on some level, they represent a computer saying mean things about players you might like. You probably aren’t shocked by this, though you might be surprised to learn that the time of year I get the most complaints is during the stretch run rather than the preseason. And while some of the complaints I hear are about projections that missed the mark, the majority are about how little the in-season projections have changed since the start of the year. It can be frustrating when a player who is slugging .500 despite a preseason SLG projection of .350 only has a rest-of-season SLG projection of .400. Clearly, the conventional wisdom says, the projections are too slow to change. Ben Clemens has written a number of pieces auditing our playoff odds, and while they aren’t as meticulously perfected as a 1996 Lexus, they’re pretty darn good. These calculations rely heavily on our in-season projections, which at their gooey, caramel center are an attempt to combine what we knew about a player or team before the season (in the form of preseason projections) with what we’ve learned since. The relevant question then becomes how much a few months of performance should change what we thought about a player in March. And as it turns out, it’s less than the folks who find projections frustrating might think. When it comes to ZiPS, the preseason projections, both for teams and individual players, are more predictive of rest-of-season performance than season-to-date numbers. That holds true even very late in the season, when there’s been a lot of cumulative in-season performance to look at. I’ve tested preseason projections versus in-season performance as late as September 10 each year, and the preseason projections never clearly do worse than the in-season stats. Since we’re right at the start of September, I thought this would be a good opportunity to look at how the ZiPS preseason projections stack up against March-through-August performance when it comes to projecting what happens in the final month of the season. And to be clear, I don’t think this preseason edge is exclusive to ZiPS; I expect that Steamer and PECOTA perform similarly well. It’s just that I have a rather unique level of access to ZiPS. But data is more important than a simple claim, so let’s dig in. Let’s start with the team projections. Teams are where you might expect the season-to-date numbers to perform the absolute best compared to preseason projections. In addition to performance data, team seasonal numbers also include information about roster construction and injuries that a preseason projection can’t possibly have. ZiPS has run team projections since 2005. If we eliminate 2020 and 2026 from the mix (2020 due to its shortened slate, this season because it’s not yet over), we have 600 projected team winning percentages, ranging from a high of .611/99 wins (the 2021 Dodgers) to .321/52 wins (the 2025 White Sox). I then compared the preseason projected winning percentages to the actual team winning percentages through August 31, and pitted them against each other head-to-head to see which set of numbers did better when it came to actual September results. You Aren't a FanGraphs Member It looks like you aren't yet a FanGraphs Member (or aren't logged in). We aren't mad, just disappointed. We get it. You want to read this article. But before we let you get back to it, we'd like to point out a few of the good reasons why you should become a Member. 1. Ad Free viewing! We won't bug you with this ad, or any other. 2. Unlimited articles! Non-Members only get to read 10 free articles a month. Members never get cut off. 3. Dark mode and Classic mode! 4. Custom player page dashboards! Choose the player cards you want, in the order you want them. 5. One-click data exports! Export our projections and leaderboards for your personal projects. 6. Remove the photos on the home page! (Honestly, this doesn't sound so great to us, but some people wanted it, and we like to give our Members what they want.) 7. Even more Steamer projections! We have handedness, percentile, and context neutral projections available for Members only. 8. Get FanGraphs Walk-Off, a customized year end review! Find out exactly how you used FanGraphs this year, and how that compares to other Members. Don't be a victim of FOMO. 9. A weekly mailbag column, exclusively for Members. 10. Help support FanGraphs and our entire staff! Our Members provide us with critical resources to improve the site and deliver new features! We hope you'll consider a Membership today, for yourself or as a gift! And we realize this has been an awfully long sales pitch, so we've also removed all the other ads in this article. We didn't want to overdo it. In a “what did better” matchup, the preseason ZiPS projections were closer than the season-to-date projections to the actual September results 309 times out of 600, or 51.5% of the time. While ZiPS wins this round, the season-to-date numbers win when you look at the magnitude of misses. The preseason projections had a mean absolute error of 87 points of winning percentage and an RMSE of 110 points of winning percentage, while the season-to-date numbers had a MAE of 85 points and an RMSE of 107 points. If you look at the following season, however, the ZiPS projections claw back a lead, both against the season-to-date results through the end of August and the full-season results. What this means is that if you were projecting the 2027 season and all you had were the 2026 ZiPS preseason projected standings (with no updated information about the construction of the roster) and the actual 2026 results, the ZiPS projected standings would, if history holds, do a better job. Preseason ZiPS wins 52.8% of the next-year battles, with a slightly lower MAE and RMSE than the full-season data. Let’s shift over to hitters. From 2004 to 2025, there have been 2,196 players who had at least 100 plate appearances in September and at least 300 plate appearances for the full season, and who also had a preseason ZiPS projection (a few players have fallen through the cracks over the years, especially in ZiPS’ early going). Going by wRC+, the preseason ZiPS projections win the head-to-head battle versus season-to-date numbers (50.4%), if only slightly, and have both a lower MAE (28 points vs. 30 points of wRC+) and RMSE (35 points vs. 38 points). If you modeled September wRC+ based only on preseason ZiPS wRC+ and March-August wRC+, the ideal mix from 2004 to 2025 would be 62% ZiPS/38% season-to-date. The same basic effect exists for pitchers. I included pitchers with at least 20 innings pitched in September and at least 120 innings for the full season. ZiPS does quite a bit better against season-to-date numbers in ERA+, as a pitcher’s actual numbers have a lot of noise in them. ZiPS wins 55.3% of the head-to-head matchups (1,166 of 2,107), and beats the season-to-date numbers in both MAE (48 points of ERA+ vs. 51 points) and RMSE (85 points vs. 95 points). If you modeled September ERA+ based on just preseason ZiPS ERA+ and March-August ERA+, the ideal mix from 2004 to 2025 would be 69% ZiPS/31% season-to-date. We’re getting into even smaller sample sizes here, but I also looked at players age 25 and younger and age 35 and older to see if the season-to-date numbers had an additional edge, as recent performance would be expected to be more volatile for players of these ages. They come closer, but the preseason projections still win, with an ideal mix of preseason and season-to-date numbers being 57% preseason/43% season-to-date for the hitters and 60%/40% for the pitchers. Now, if the conclusion that you draw from all of this is that what happens during the season doesn’t matter, you would be sorely mistaken. When September rolls around, we know quite a bit more about who a player is, whether he’s is healthy, and which teams are good than we did back in March. All in-season projection systems incorporate this information, and the projections definitely move. They just don’t move as much as our brains want them to. Recency bias tends to have a powerful effect on us because the recent stuff is the stuff we just watched. Seeing Otto Lopez hit .305/.340/.442 over most of a season feels like overwhelming evidence of how good he is in a way that a projection generated in March simply doesn’t. Jordan Walker is having a wonderful 2026, the sort of season I had given up on as a reasonable possibility for him. Given that, Cardinals fans may be disappointed that despite his breakout and his relative youth, the array of public projection systems mostly peg him in the 105-110 wRC+ range going forward. Still, as tempting as it might be, just saying “OK, Walker is a borderline star from now on” goes beyond properly evaluating the near-present and chucks out everything that tells a different story. The same goes for teams. The Mets, Orioles, Blue Jays, and Tigers have all underperformed relative to our preseason expectations, and all moved key players at the trade deadline. Since August 3, those teams have combined to go 55-47 (through Monday’s games), good for an 87-75 seasonal pace. Perhaps the original story — that these clubs were pretty talented — was actually the right one, and they simply played poorly for four months. After all, those preseason projections represent years of information about players, their development, and their ups-and-downs, and that doesn’t just evaporate into meaninglessness. The actual season determines who wins each game, who plays in October, and which team gets to pop champagne at the end, and each one gives us an enormous trove of new information about players. But that new information doesn’t magically transform several hundred plate appearances or 100 innings into a comprehensive description of a player’s ability. With that in mind, you may want to think twice before treating the “Season to Date” projection mode on our playoff odds page as more than an interesting amusement. Baseball seasons are important because they’ve actually happened, while projections are useful because the next game hasn’t. When looking at what’s to come in the next game, week, month, or season, the past is more than mere prologue.
Yes, Preseason Projections Still Matter
Full Article
Original Source
Read the full article at Blogs →KhanList aggregates and links to publicly available news content. We do not host full articles from third-party sources. Always verify important information with original sources.