
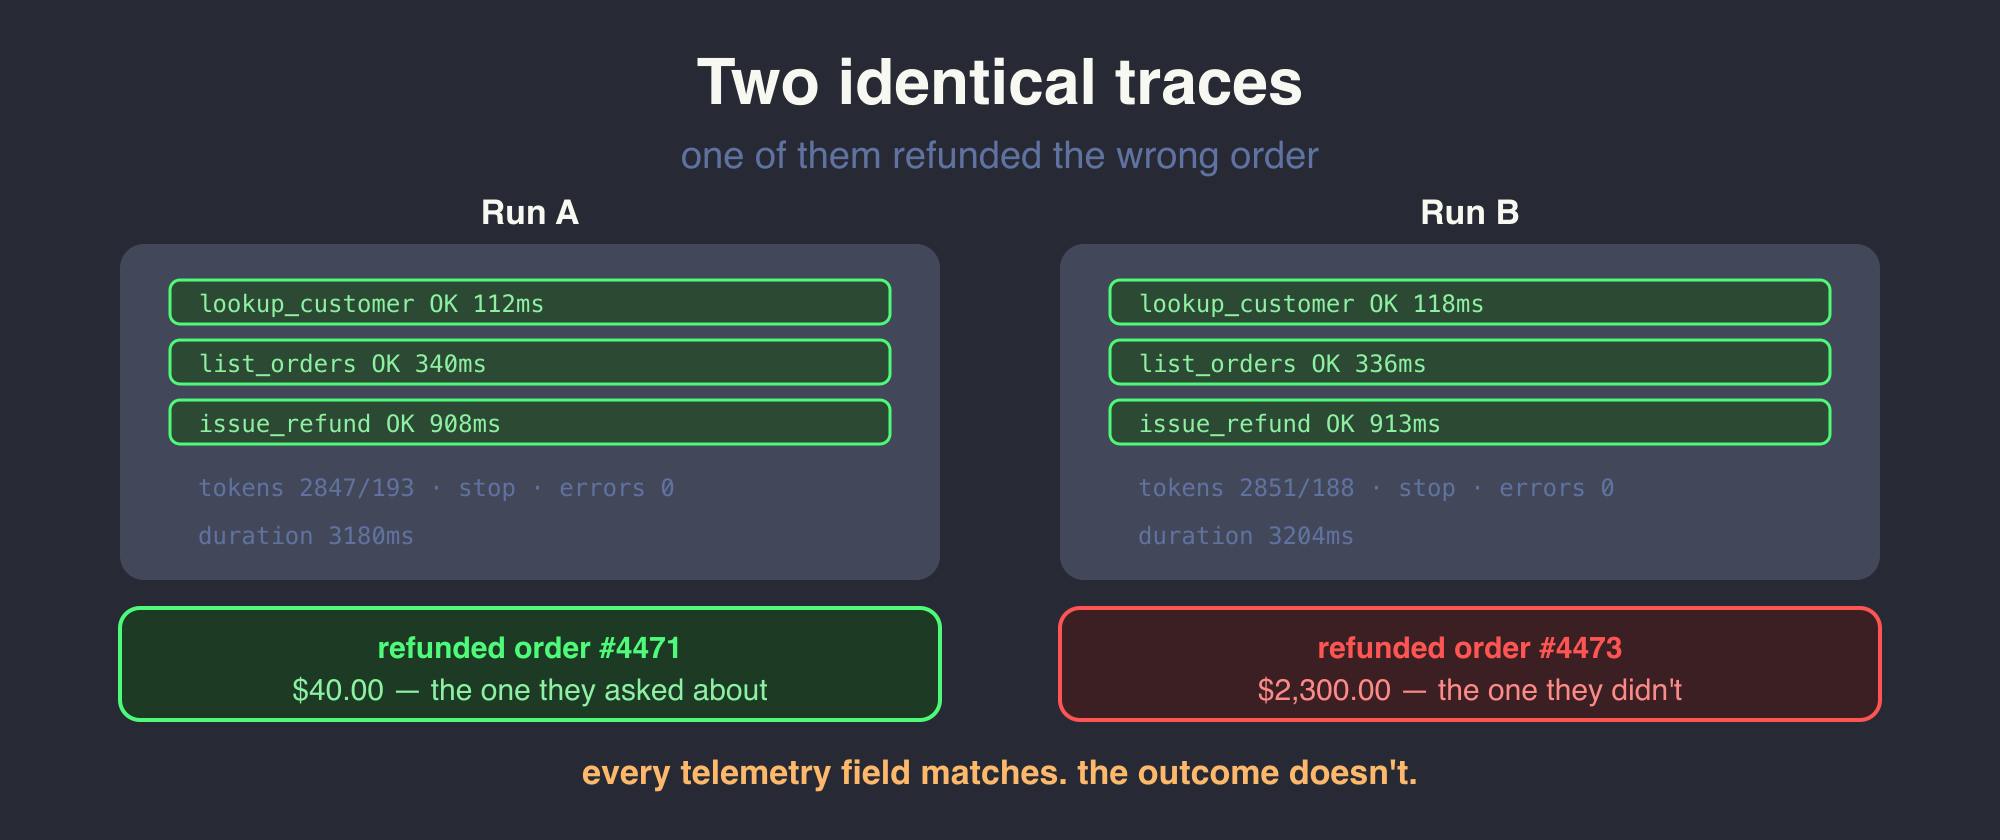
Two tracesHere is the shape of the problem, in the only form that makes it obvious. A support agent handles refund requests. Two runs, side by side, as your observability platform renders them.// Run A { "trace_id": "a41f…", "gen_ai.operation.name": "agent_run", "gen_ai.request.model": "claude-sonnet-4-6", "duration_ms": 3180, "gen_ai.usage.input_tokens": 2847, "gen_ai.usage.output_tokens": 193, "gen_ai.response.finish_reasons": ["stop"], "spans": [ { "name": "lookup_customer", "status": "OK", "duration_ms": 112 }, { "name": "list_orders", "status": "OK", "duration_ms": 340 }, { "name": "issue_refund", "status": "OK", "duration_ms": 908 } ], "error_count": 0 } // Run B { "trace_id": "b73c…", "gen_ai.operation.name": "agent_run", "gen_ai.request.model": "claude-sonnet-4-6", "duration_ms": 3204, "gen_ai.usage.input_tokens": 2851, "gen_ai.usage.output_tokens": 188, "gen_ai.response.finish_reasons": ["stop"], "spans": [ { "name": "lookup_customer", "status": "OK", "duration_ms": 118 }, { "name": "list_orders", "status": "OK", "duration_ms": 336 }, { "name": "issue_refund", "status": "OK", "duration_ms": 913 } ], "error_count": 0 } Every field that your monitoring dashboard aggregates is, for practical purposes, identical. Both runs are three spans, all OK, no errors, ~3.2 seconds, ~2,850 input tokens, a clean stop finish. On a latency percentile chart they are the same point twice. On a token-spend chart they are the same point twice. On an error-rate chart they contribute equally to a rate of zero.In Run B the customer had two orders — a $40 one they were complaining about and a $2,300 one they weren't. The agent called issue_refund on the second.Nothing in that trace is wrong. issue_refund really was called. It really did return OK, because refunding $2,300 is an entirely successful refund. The span is green because the API call succeeded, and the API call succeeding is the only thing a span status has ever meant.The gap has a number attached to itThis is not a hypothetical asymmetry, and it isn't rare. LangChain's *State of Agent Engineering* report, published 23 May 2026 and drawn from 1,340 responses collected between 18 November and 2 December 2025, puts numbers on both halves:Adoption:Agents in production: 57% (67% at 10,000+ employees)Observability implemented: 89% overall, 94% among production teamsFull per-step tracing: 62% overall, 71.5% among production teamsOffline evaluations on a test set: 52.4%Online evaluations in production: 37.3% (44.8% among production teams)Both offline and online: fewer than a thirdObservability is close to universal; systematic evaluation is roughly a coin flip. And the same survey names quality — accuracy, relevance, consistency, tone — as the top barrier to getting agents into production, cited by about a third of respondents. Those two findings sit awkwardly together. Quality is the thing most likely to block a deployment, and it is the thing least likely to be measured. Roughly nine teams in ten can reconstruct what their agent did last Tuesday. About five in ten can tell you whether it was any good.The instinct to instrument first is a reasonable one, and the tooling market rewarded it — tracing is a solved, buyable, drop-in problem. Evaluation is not buyable in the same way, because it requires you to state what *correct* means for your domain, and nobody can do that for you. Observability got adopted at the speed of a vendor integration. Evaluation adoption moves at the speed of the hardest product conversation on your team.Why the dashboard structurally cannot tell youIt's worth being precise about *why* the traces above are indistinguishable, because the reason isn't an oversight anyone will patch.The OpenTelemetry GenAI semantic conventions define the standard attribute registry for instrumenting LLM and agent workloads — the fields your platform is almost certainly collecting. The core ones:gen_ai.request.model, gen_ai.provider.name — which model answeredgen_ai.usage.input_tokens, gen_ai.usage.output_tokens, plus cache-read, cache-creation and reasoning token counts — how much it costgen_ai.response.finish_reasons — why it stoppedgen_ai.operation.name — chat, tool_call, agent_rungen_ai.input.messages, gen_ai.output.messages — what went in and came outRead that list looking for the field that goes red when the agent refunds the wrong order. It isn't there, and it can't be, because every one of those attributes is a property of the call rather than of the answer. Cost, latency, model version and stop reason are all knowable from inside the request/response cycle. Correctness is only knowable with reference to something outside it — a ground truth, a business rule, a resulting state you can inspect.The conventions do include an evaluation namespace — gen_ai.evaluation.name, `gen_ai.evaluation.score.value`, `gen_ai.evaluation.score.label`, `gen_ai.evaluation.explanation` — and `score.label` accepts values like `"correct"`. But that namespace is a slot, not a sensor. Those attributes are empty until something you wrote computes a judgement and populates them. The standard has a correctness-shaped hole in it and expects you to bring your own filling. Most teams ship the ninety per cent that auto-instruments and never fill the hole.This is the practical consequence: your alerting is wired to signals that do not move when quality moves. Latency won't regress when the agent starts refunding the wrong order — it might even improve. Token counts won't move. Error rate stays at zero, because from the runtime's point of view nothing failed. You will find out from a customer.A two-panel comparison titled "A property of the call vs. a property of the outcome". The left panel, "What the trace records", lists six telemetry fields — gen_ai.request.model, gen_ai.usage.input_tokens, gen_ai.usage.output_tokens, gen_ai.response.finish_reasons, gen_ai.operation.name, and duration_ms with span.status — noted as all knowable from inside the request/response cycle, auto-instrumented, 89% adoption. An arrow labelled "the gap evals fill" points to the right panel, "What the trace cannot record", which shows the question "was $2,300.00 the right order to refund?" above three things that could answer it: an annotated goal state, the resulting database rows, and a business rule you wrote down. A caption reads: gen_ai.evaluation.* exists in the spec as an empty slot; nothing populates it until you write the check.Every field a trace carries is a property of the call. Correctness is a property of the outcome, and the outcome has to be checked against something the request doesn't contain.What measuring the outcome actually looks likeThe fix has a well-established precedent, and it predates the current agent wave: verify the resulting state, not the transcript.τ-bench, the tool-agent-user benchmark from Sierra, is built on exactly this move. Its authors describe the method plainly: they "employ an efficient and faithful evaluation process that compares the database state at the end of a conversation with the annotated goal state." Not the wording of the reply. Not whether the right tool name appeared. The database, afterwards, against what the database should have contained.Applied to Run B above, that check is unglamorous and about four lines long:def verify_refund(conversation, db_before, db_after): expected = conversation.annotated_goal # refund order #4471, $40.00 actual = diff(db_before, db_after) # refunded order #4473, $2,300.00 assert actual.refunded_order_ids == expected.refunded_order_ids assert actual.total_refunded_cents == expected.total_refunded_cents That assertion fails on Run B and passes on Run A. No telemetry field distinguished them; a four-line state diff does it instantly. The same pattern generalises to whatever your agent actually touches — if it writes code, run the test suite; if it files tickets, assert on the ticket's fields; if it produces a document, check the document against the source.τ-bench also contributes a metric worth stealing outright. Alongside the usual pass@k ("at least one of k attempts succeeded"), the paper proposes pass^k — all k attempts succeeded — "to evaluate the reliability of agent behavior over multiple trials." This is the honest metric for anything customer-facing, because your customers are not running your agent eight times and keeping the best result; they're getting one run each. The arithmetic is brutal and worth internalising: an agent that succeeds 90% of the time, if failures are roughly independent, is fully reliable across eight consecutive runs only 0.9⁸ ≈ 43% of the time.The benchmark's own headline finding, from the abstract, is the part most teams have not absorbed: "even state-of-the-art function calling agents (like gpt-4o) succeed on 0.95) coexists with severe position bias (>0.10)" in production judges. A judge that returns the same verdict every time looks trustworthy on a stability check and can still be reliably wrong in a direction that tracks the order you presented the options in.None of this makes LLM-as-judge unusable — it remains the only practical option for open-ended generation where no reference string exists. It does mean a judge is a component that itself requires a labelled validation set, a chance-corrected agreement statistic, and a position-swap check before you let it gate a release. Where you can verify state instead, verify state: an assertion on a database row has no position bias.Turning the traces you already have into the evals you don'tThe useful thing about being in the 89% is that you are already sitting on the raw material. Traces are unlabelled evaluation data. The work is labelling and replaying them.Pull fifty real traces from last month, weighted toward the unusual: long tool chains, retries, sessions a human took over, anything a customer followed up on. Not fifty happy paths — happy paths inflate every number you're about to compute.For each one, write down what should have happened, in a form a program can check. An order id. A row count. A set of fields. An exit code. If you cannot express it as an assertion, that's the product conversation surfacing, and it is better to have it now than during an incident.Replay them on every change — prompt edits, model version bumps, tool-schema changes, dependency upgrades — and gate the release on the result. This is the step that converts the set from a document into a regression gate. It is also, mechanically, unit testing; the only novel part is that the assertions run against end state rather than return values.Report pass^k, not just the mean. Run each case several times and count only the cases that pass every time. The number will be worse than your average, and it is the one that corresponds to what a single user experiences.Feed failures back. Every production failure becomes case fifty-one. The set gets stronger exactly where the system is weakest, which is the whole point of curating it by hand.Steps 2 and 3 are where teams stall, and the reason is rarely technical — it's that "what should have happened" turns out to be genuinely contested between engineering, support and finance. Working through that with a versioned golden set and a regression gate on every change is a chunk of what SophiArch spends its validation module on, alongside the observability side that most teams have already built. The two lessons sit deliberately close together, because shipping one without the other is the failure this whole article is about.The one-line versionObservability answers "what happened?" Evaluation answers "should it have?" The first question is solved, buyable and nearly universally adopted. The second is the one your customers are actually asking, and roughly half of teams running agents in production still have no systematic way to answer it.If you have 89% of the stack, the remaining work isn't another dashboard. It's fifty labelled traces and an assertion that fails.
Why Agent Observability Cannot Replace Evaluation
Full Article
Original Source
Read the full article at Hackernoon →KhanList aggregates and links to publicly available news content. We do not host full articles from third-party sources. Always verify important information with original sources.