
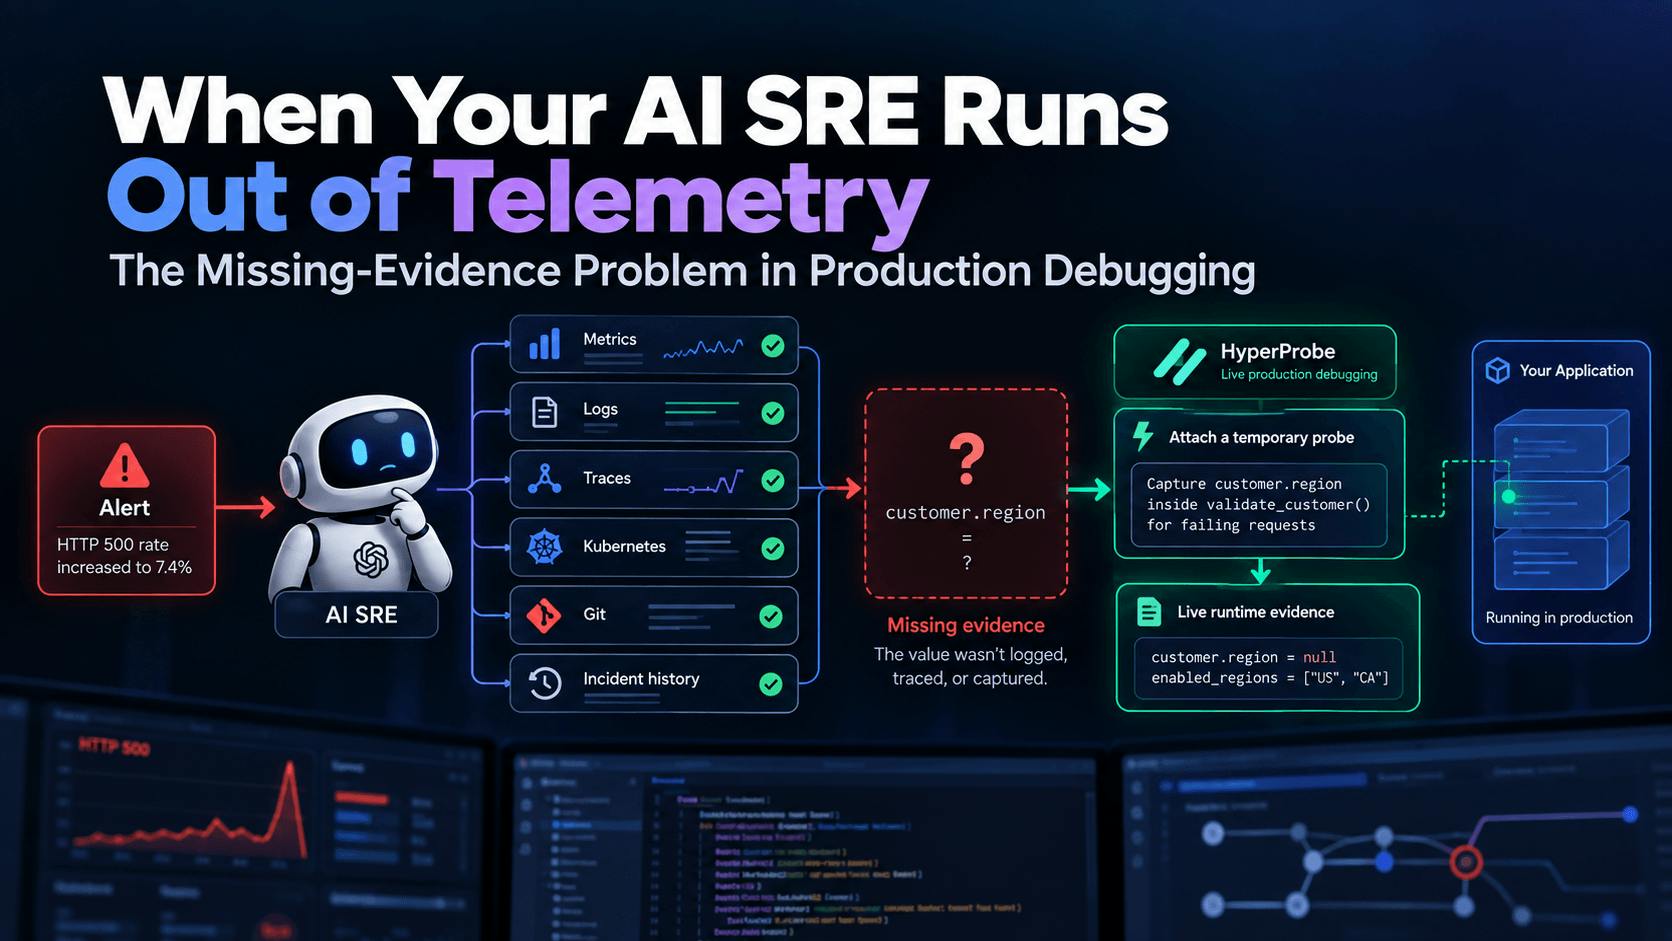
AI SRE systems are getting much better at the first half of incident investigation.An agent can receive an alert, inspect metrics, search logs, follow distributed traces, check recent deployments, read source code, retrieve runbooks, and compare the current failure with previous incidents. With enough integrations, it can gather in minutes what once required an engineer to move across several tools. But there is a hard limit to this model. Sometimes the information required to diagnose an incident is not buried somewhere in your stack. It was never collected in the first place. A trace may tell you which function failed. A log may tell you which exception was thrown. Deployment history may tell you exactly which commit introduced the behavior. Source code may narrow the investigation to three suspicious lines. None of those systems can tell you the value of a local variable at the moment of failure if that value was never logged, traced, or otherwise captured. At that point, the question is no longer: Can the AI SRE reason better? It becomes: Does the AI SRE have the evidence required to answer the question? That is the missing-evidence problem. And it may be one of the most important limitations to understand when evaluating AI SRE systems. Observability Gets You Close to the Bug, but Not Always to the Cause Consider a production checkout service that begins returning intermittent HTTP 500 errors. The alert tells the AI SRE that the error rate has climbed from 0.2% to 7.4%. Deployment history shows a release four minutes before the spike began. Distributed traces show that most failed requests follow the same code path, while the application logs contain repeated InvalidRegionException errors. The first few minutes of the investigation look promising: 14:03 checkout-api deployment a83f9c2 completed 14:07 HTTP 500 rate begins increasing 14:08 InvalidRegionException appears 14:09 checkout errors reach 7.4% The trace narrows the affected path: checkout-api | +-- validateCustomerRegion() | +-- calculateTax() | +-- createOrder() ERROR The source diff makes the deployment even more suspicious. Validation around customer.region changed in a83f9c2. This is already a successful observability workflow. Metrics detected abnormal behavior. Deployment metadata identified a relevant change. Tracing localized the failure. Logs provided the exception. Source control explained what changed. The AI SRE can now form a reasonable hypothesis: The new validation logic is allowing an invalid or missing region value to reach createOrder(). But the hypothesis still contains a missing fact: What was customer.region on an actual failing request? If the application never recorded that value, there is nothing left for the observability platform to retrieve. That is where production debugging changes shape. Not Every Incident Has the Same Information Problem A useful way to think about AI SRE is to separate three problems that often get bundled together. 1. Retrieval problem The first is a Retrieval problem. The information exists, but the investigator has not found it yet. Perhaps the answer is buried in a runbook, an old postmortem, a deployment record, a trace, or a dashboard. Search, RAG, operational APIs, and agent tooling can help here. 2. Reasoning problem The second is a reasoning problem. The information exists and has been retrieved, but understanding the relationship between signals is difficult. For example, latency increased shortly after a deployment, one downstream service is returning errors, and only a specific customer segment is affected. An LLM can help correlate those facts and generate plausible explanations. 3. Observation problem The third is an observation problem. The information required to distinguish between those explanations was never captured. These problems require different solutions: Information exists but is hard to find | v Better retrieval Information exists but is hard to interpret | v Better reasoning Information does not exist in telemetry | v Acquire new evidence A large part of AI-assisted incident response focuses on the first two. The third is where the evidence ceiling appears. Modern agent integrations make it increasingly easy for an AI SRE to query operational systems directly. It may be able to inspect Prometheus metrics, Sentry issues, APM traces, PagerDuty incidents, Kubernetes state, Git history, cloud events, and deployment metadata without waiting for an engineer to switch between tools. That is a meaningful improvement. But access to more systems does not automatically mean access to more facts. It only means better access to facts those systems already possess. Connecting an agent to Sentry gives it access to whatever Sentry captured. Connecting it to Prometheus gives it access to exposed metrics. Connecting it to Git tells it what the code says should happen. Connecting it to Kubernetes tells it what the cluster knows. None of those integrations can answer: customer.region = ? if no connected system ever recorded that value. This is why a larger context window, better retrieval, or more tools eventually stop helping. The AI SRE has reached the edge of its telemetry. The Dangerous Part Is What Happens After That LLMs are very good at constructing coherent explanations from incomplete information. That ability is useful when you treat the output as a working hypothesis. It becomes dangerous when you present a plausible explanation as a verified root cause. Return to the checkout incident. We know: the incident started four minutes after a deployment the affected execution path includes region validation the application throws InvalidRegionException the validation logic changed in that release The model could reasonably conclude: The deployment introduced a bug that allows customer.region to be null. That explanation may be correct. But the same evidence could fit other explanations. Perhaps: customer.region = "US-WEST" but "US-WEST" disappeared from a configuration table. Perhaps serialization corrupts the field before createOrder(). Perhaps a feature flag routes only a subset of users through a legacy validation path. Existing telemetry has narrowed the search space, but it has not yet distinguished among those possibilities. This is why the concept of an evidence gate is useful. A recent HackerNoon article on AI agents needing an evidence gate rather than unrestricted production access makes the broader point that telemetry can be incomplete, stale, or merely correlated, and that AI-generated conclusions should be separated from verified facts. For an AI SRE, that principle should apply before remediation even enters the conversation. The system should be able to say: I have enough evidence to identify the suspicious code path, but not enough evidence to confirm the root cause. That is not a failure. That is correct incident reasoning. The Traditional Fix Is to Add Logging Engineers already have a standard way to collect the missing value. They add a log line. For example: logger.info( "customer region during validation", customer_id=customer.id, region=customer.region) Then the team opens a pull request, runs CI, deploys a new build, waits for the failure to occur again, and inspects the resulting logs. The cycle looks like this: Missing value | v Add logging | v Open PR | v CI / Review | v Deploy | v Wait for failure | v Inspect value The process works. The problem is that the code change exists only to collect diagnostic evidence. If the captured value does not explain the failure, the engineer adds another log statement and repeats the cycle. For bugs tied to production traffic, feature flags, concurrency, real customer data, or infrastructure state, reproducing the exact behavior outside production may be difficult. Adding logging therefore becomes the practical path forward. That is also where incident investigation can become slow. Dynamic Instrumentation Shortens the Evidence Loop Dynamic instrumentation provides another option. Instead of modifying source code every time another value is needed, diagnostic capture can be attached to a program while it is already running. For debugging, that can mean placing a temporary capture point at a specific line and reading selected runtime state when execution reaches that location. Conceptually: AI SRE suspects customer.region | v Target validate_customer() | v Attach temporary read-only probe | v Next matching request executes | v Capture selected state | v Remove / expire probe This is not the same as attaching a traditional debugger and stopping a production thread. Production-oriented dynamic instrumentation needs to be bounded and non-blocking. That means controls such as: read-only capture automatic expiry rate limits capture-size limits sensitive-data redaction conditions restricting when a probe fires alignment with the deployed code version HyperProbe describes dynamic instrumentation as adding monitoring or capture logic to a running program without rebuilding or restarting it, and its documentation specifically covers temporary, read-only capture for live production debugging. The important point is not the mechanism by itself. It is what the mechanism changes about AI-assisted debugging. The agent no longer has to stop at: I think this variable may be wrong. It can ask: What value would I need to observe to prove or disprove that hypothesis? That is a much stronger investigation loop. Where HyperProbe Fits HyperProbe is an AI on-call agent, and sits alongside an existing observability and alerting stack. That distinction matters because it is not a replacement for observability. Observability tools continue to provide production signals such as errors, latency, dependencies, and historical evidence, while the AI SRE operates in the investigation layer. HyperProbe also distinguishes systems that reason only over collected telemetry from systems that can add missing evidence while the service is still running. That makes the workflow complementary: Alerting | v Something is wrong Metrics / Logs / Traces | v Where is it going wrong? Deployment + Source | v What changed? AI SRE | v What are the likely explanations? HyperProbe runtime evidence | v What state actually existed? Verification | v Which explanation survives the evidence? The product's live production debugging capability is what matters here. HyperProbe can use read-only probes against a running service to capture runtime state that was not already present in logs or traces. Its documentation also describes self-expiring capture, rate limits, sensitive-data redaction, and code-version alignment as part of that model. Return to the checkout example. The AI SRE has two hypotheses: H1: customer.region is null H2: enabled_regions contains stale configuration The missing evidence is obvious: customer.region enabled_regions A bounded runtime capture can collect those values from a failing execution. Suppose the result is: customer.region = null enabled_regions = ["US", "CA", "GB"] Now the investigation is materially different. The second hypothesis can be weakened or rejected. The first is supported by direct runtime evidence. Compare these two outputs: The deployment probably introduced a null-region bug. and: A failing request reached validate_customer() with customer.region = null after deployment a83f9c2. The first is a plausible inference. The second contains direct evidence. That is the difference between reasoning over telemetry and gathering the missing evidence required to verify a hypothesis. An Evidence-Gathering AI SRE Has a Different Loop A conventional agentic incident workflow often looks like: Retrieve -> Reason -> Recommend That model works when the evidence already exists. For production debugging, a stronger loop is: Retrieve existing evidence | v Generate hypotheses | v Identify uncertainty | v Determine missing evidence | v Acquire bounded runtime evidence | v Confirm or reject hypotheses | v Human review / remediation This is a small architectural change with significant consequences. The LLM is no longer expected to manufacture certainty from incomplete telemetry. Its role becomes more disciplined: identify what is known distinguish fact from inference generate competing hypotheses determine what evidence is missing request the smallest useful observation update the diagnosis based on new evidence That is much closer to how experienced engineers debug. They do not simply stare at existing logs until the answer appears. They form a hypothesis, decide what observation would prove or disprove it, collect that observation, and update their understanding. AI SRE should work the same way. Runtime Evidence Needs Stronger Guardrails Than Read-Only Telemetry There is an obvious safety concern. Giving an AI system access to runtime state requires stricter controls than letting it read a dashboard. The model should not receive unrestricted capability to execute arbitrary expressions against live application memory. A safer architecture separates reasoning from capture policy. The AI layer might request: Capture customer.region inside validate_customer() for requests matching the incident context A deterministic control layer should decide whether the request is allowed. Checks can include: whether the requested code location exists in the deployed version whether the operation is read-only whether the requested field may contain sensitive data how many captures are permitted how long the probe may remain active how much data each capture can return whether the probe is scoped to the relevant request or condition This mirrors the broader production-agent principle HackerNoon has discussed around using explicit control boundaries rather than simply trusting the model's judgment. The same evidence-gate model argues for scope controls, corroboration, human gates, and clearly separated decision tiers. For runtime debugging, the equivalent rule is straightforward: The AI can decide what evidence it needs. Deterministic policy should decide how that evidence may be collected. That separation is critical. Observability Still Comes First None of this reduces the importance of observability. Quite the opposite. Runtime capture becomes useful because the observability stack has already narrowed the problem. Without metrics, the system may not know that checkout errors increased. Without traces, it may not know which service or code path is implicated. Without logs, it may not have the exception. Without deployment history, it may not know which release deserves scrutiny. Without source context, it may not know which variable is worth inspecting. Runtime evidence comes later in the funnel: Metrics "Error rate increased" | v Traces "Failures converge on checkout-api" | v Logs "InvalidRegionException" | v Deployment + source "Validation changed here" | v Runtime state "customer.region = null" | v Verified explanation Each layer reduces uncertainty. The mistake is expecting one layer to do the job of all the others. There is a similar lesson in the way teams build observability for AI systems themselves. HackerNoon's coverage of production observability for multi-agent AI shows why logs alone are not enough to explain how a complex agent behaved in production. The same principle applies in reverse to AI SRE: a large collection of telemetry is useful, but you still need the right evidence for the specific question you are trying to answer. Stop Evaluating AI SRE Only by How Quickly It Produces an Answer One evaluation criterion deserves more attention as AI SRE matures: How does the system behave when the evidence is incomplete? A system that always produces a root cause can look impressive in a demo. In production, that should make engineers cautious. A stronger AI SRE should distinguish among: observed facts correlations hypotheses contradictory evidence missing evidence verified conclusions It should also be able to explain why another observation is required. For example: InvalidRegionException correlates with deployment a83f9c2, and the changed validation function appears in sampled failures. The current telemetry does not include customer.region, so the null-value hypothesis cannot yet be verified. That answer is more useful than a confident but unsupported declaration. It tells the engineer where the boundary of current knowledge lies. It also defines the next investigative step. The Real Limit Is Often Observation, Not Intelligence Models will continue to improve. Operational integrations will get easier to build. Agents will gain access to more tools. Context windows will grow. Retrieval systems will become better at finding relevant runbooks, traces, deployments, and previous incidents. Those advances matter. But they do not change a fundamental constraint: An AI SRE cannot reason its way to a production state that nobody observed. When the required fact already exists, retrieve it. When several facts need to be connected, let the model reason over them. When the decisive evidence does not exist, collect it. That is why AI SRE should not end at: Retrieve -> Reason -> Answer A better production loop is: Retrieve | v Reason | v Identify uncertainty | v Gather missing evidence | v Verify HyperProbe fits specifically into that missing-evidence part of the investigation. It is an AI on-call agent that sits alongside the existing observability and alerting stack, using live production debugging to capture evidence from running services when pre-collected telemetry is no longer enough. Because when an AI SRE runs out of telemetry, the answer should not be to make the model guess harder. It should be to collect the evidence the investigation is missing.
When Your AI SRE Runs Out of Telemetry: The Missing-Evidence Problem in Production Debugging
Full Article
Original Source
Read the full article at Hackernoon →KhanList aggregates and links to publicly available news content. We do not host full articles from third-party sources. Always verify important information with original sources.