
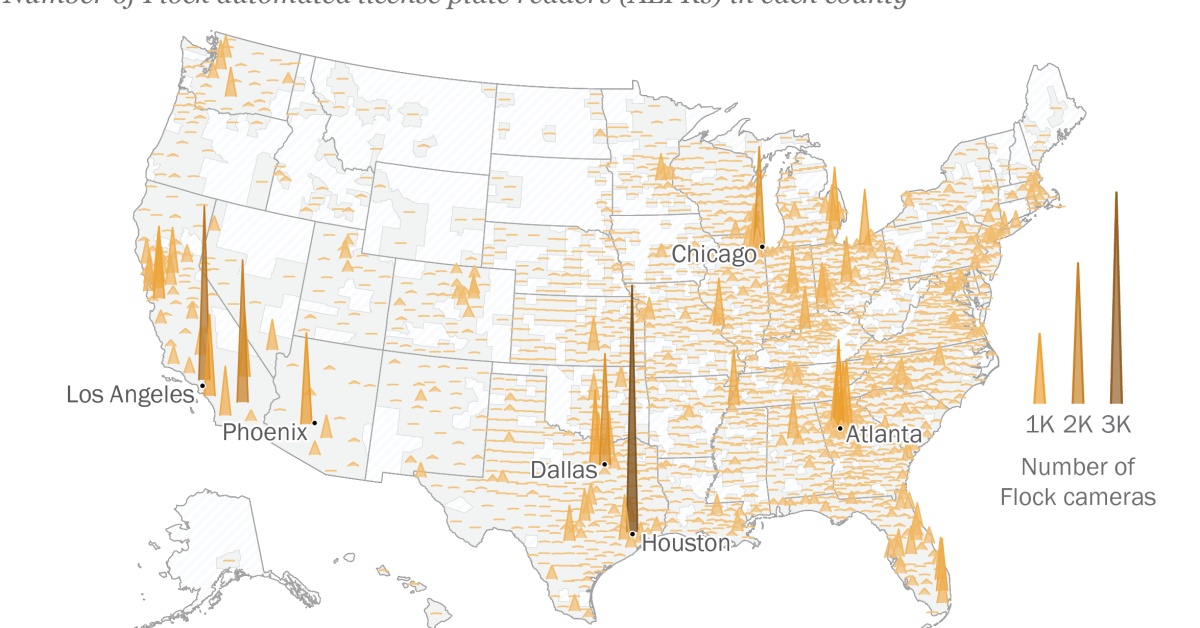
Automated license plate readers (ALPRs) are high-speed camera systems that automatically photograph every license plate that passes them. When networked together and paired with specialized software, they can reconstruct where a vehicle has been over a period of days or weeks. The technology was initially developed in the United Kingdom in the mid-1970s to aid in terrorism investigations and is now used widely by public safety agencies in the United States. Flock Safety, founded in 2017, is the leading ALPR vendor. The company estimates that its cameras were used to help with more than 1 million law enforcement investigations in 2025. But there have also been abuses of the company’s technology, including multiple investigations into stalking and misconduct by law enforcement. As a result, some lawmakers in Congress have proposed bills to more tightly regulate ALPRs – or potentially ban them outright. Here is what we know and don’t know about Flock cameras, based on data from Flock and other sources. In this analysis, the phrase “Flock cameras” specifically refers to the company’s license plate reader technology. We use the phrases “law enforcement agency” and “public safety agency” interchangeably. About this research This Pew Research Center analysis looks at the locations and reported usage of Flock automated license plate readers, better known as “Flock cameras.” Why did we do this? Pew Research Center does research to help the public, media and decision-makers understand important topics. This analysis builds on our recent work about technology policy issues. Learn more about Pew Research Center. How did we do this? Data on the number and locations of Flock cameras comes from OpenStreetMap, a crowdsourced mapping project. We used the Overpass API and filtered it to nodes tagged as “surveillance,” “ALPR” and “Flock Safety.” The data is current as of Sept. 17, 2026. Because OpenStreetMap relies on volunteer mapping rather than an official inventory, camera counts should be read as a lower-bound sample rather than a complete count. Coverage may be uneven across regions depending on local mapping activity. Read more about OpenStreetMap’s data model and methodology. Data on individual agencies’ self-reported camera and search statistics comes from EyesOnFlock, a project that scrapes the public “transparency portals” Flock Safety provides to its customers. The data reflects 1,517 agencies that had an active public portal as of Sept. 21, 2026. In addition, we used the U.S. Census Bureau’s urban-rural classification, state and county geographies, population estimates and tract demographics information to analyze the geography, population and demographics of neighborhoods with mapped Flock cameras. How many Flock cameras are out there? States with the most Flock cameras per 100K residents Number of Flock automated license plate readers (ALPRs) per 100,000 residents, by state Source: Pew Research Center analysis of 109,577 Flock ALPR nodes from OpenStreetMap (accessed Sept. 17, 2026); U.S. Census Bureau 2025 population estimates. PEW RESEARCH CENTER States with the most Flock cameras per 100K residents Number of Flock automated license plate readers (ALPRs) per 100,000 residents, by state StateFIPSNumber of Flock cameras per 100k residentscamera_countpopulationGeorgia1380894411180878Ohio3951602411883304Texas48491531831290831Indiana184833286924275Alabama014724485157699Kansas204312722970606Tennessee474330837227750Illinois1742532012710158Missouri294024816245466California06391545039431263Colorado083621245957493Kentucky213516074588372South Carolina453518935478831Louisiana223415534597740New Mexico35337052130256Mississippi28339682943045Florida1232752023372215Delaware10313271051917Arkansas05319433088354North Carolina3730328111046024Michigan2630300110140459Arizona042922317582384Oklahoma402811334095393Virginia512824338811195Wisconsin552716185960975Rhode Island44262941112308Washington532519597958180Iowa19257963241488Utah49227873503613Nevada32227253267467Minnesota272212495793151Nebraska31193802005465Connecticut09176403675069Idaho16173372001619North Dakota3815123796568South Dakota4614133924669Massachusetts25149877136171District of Columbia111390702250New Jersey341211519500851Maryland24117186263220Wyoming561166587618West Virginia54111891769979Pennsylvania4211138913078751New York3610203319867248Oregon4183244272371Montana305581137233Hawaii154651446146Maine233461405012Vermont50319648493New Hampshire331131409032Alaska020.11740133 Source: Pew Research Center analysis of 109,577 Flock ALPR nodes from OpenStreetMap (accessed Sept. 17, 2026); U.S. Census Bureau 2025 population estimates. PEW RESEARCH CENTER There are more than 100,000 Flock cameras in the United States. But the exact number varies from source to source: In a statement to The Washington Post in August 2026, Flock claimed that it had over 120,000 cameras in 6,000 communities. Volunteer mappers on OpenStreetMap have listed roughly 110,000 Flock license plate readers. These cameras make up about 80% of all the ALPRs on OpenStreetMap. The Flock Surveillance Map list, created by a private researcher, has found as many as 175,000 Flock cameras nationwide. Where are Flock cameras located? Flock does not publish a list of where its cameras are located, so we used crowdsourced data from OpenStreetMap to see where these cameras are most prevalent. Around half of all Flock cameras are in just five states. Collectively, California, Texas, Georgia, Florida and Ohio have just over 53,000. That is 49% of all Flock cameras identified on OpenStreetMap. The states with the most cameras per 100,000 people are Georgia, Ohio and Texas, followed closely by Indiana and Alabama. Multiple urban areas have thousands of Flock cameras Number of Flock automated license plate readers (ALPRs) in each county Source: Pew Research Center analysis of 109,577 Flock ALPR nodes from OpenStreetMap (accessed Sept. 17, 2026). PEW RESEARCH CENTER Multiple urban areas have thousands of Flock cameras Number of Flock automated license plate readers (ALPRs) in each county CountyStateCounty GEOIDNumber of Flock camerasHarris CountyTexas482013490Los Angeles CountyCalifornia060372457Riverside CountyCalifornia060652013Dallas CountyTexas481131572Cook CountyIllinois170311433Maricopa CountyArizona040131289Fulton CountyGeorgia131211244Orange CountyCalifornia060591149Tarrant CountyTexas484391054Santa Clara CountyCalifornia060851021San Bernardino CountyCalifornia06071934DeKalb CountyGeorgia13089902Gwinnett CountyGeorgia13135899Wayne CountyMichigan26163879Alameda CountyCalifornia06001809Cuyahoga CountyOhio39035788Shelby CountyTennessee47157782Cobb CountyGeorgia13067759Broward CountyFlorida12011740San Diego CountyCalifornia06073695St. Louis CountyMissouri29189668Sacramento CountyCalifornia06067641Franklin CountyOhio39049638Marion CountyIndiana18097633Fort Bend CountyTexas48157631Collin CountyTexas48085608Jefferson CountyAlabama01073602Palm Beach CountyFlorida12099595Jefferson CountyKentucky21111594Denton CountyTexas48121583Hamilton CountyOhio39061574DuPage CountyIllinois17043566San Mateo CountyCalifornia06081560Oakland CountyMichigan26125509Contra Costa CountyCalifornia06013507Bexar CountyTexas48029502Sedgwick CountyKansas20173468Travis CountyTexas48453453Clark CountyNevada32003429Miami-Dade CountyFlorida12086426San Francisco CountyCalifornia06075419Orange CountyFlorida12095417Yakima CountyWashington53077410Will CountyIllinois17197409King CountyWashington53033408Kern CountyCalifornia06029404San Joaquin CountyCalifornia06077404Polk CountyFlorida12105394Solano CountyCalifornia06095388Hillsborough CountyFlorida12057383Mecklenburg CountyNorth Carolina37119383Hennepin CountyMinnesota27053375Oklahoma CountyOklahoma40109374Sonoma CountyCalifornia06097357Arapahoe CountyColorado08005348Lake CountyIllinois17097348Volusia CountyFlorida12127343Montgomery CountyTexas48339331Montgomery CountyOhio39113330Pinal CountyArizona04021320Nassau CountyNew York36059315Wake CountyNorth Carolina37183311Jackson CountyMissouri29095309Snohomish CountyWashington53061306Bell CountyTexas48027304Chatham CountyGeorgia13051298Lucas CountyOhio39095293Kane CountyIllinois17089291Galveston CountyTexas48167290Tulsa CountyOklahoma40143288Summit CountyOhio39153286East Baton Rouge ParishLouisiana22033275Pinellas CountyFlorida12103274Butler CountyOhio39017271Williamson CountyTexas48491267Fairfax CountyVirginia51059259Santa Barbara CountyCalifornia06083257Jefferson ParishLouisiana22051257Winnebago CountyIllinois17201256Salt Lake CountyUtah49035252Middlesex CountyNew Jersey34023250Milwaukee CountyWisconsin55079248Suffolk CountyNew York36103244Macomb CountyMichigan26099241Placer CountyCalifornia06061240Duval CountyFlorida12031240Rutherford CountyTennessee47149239Fresno CountyCalifornia06019237Douglas CountyColorado08035234Genesee CountyMichigan26049234St. Johns CountyFlorida12109231Hidalgo CountyTexas48215228Brevard CountyFlorida12009227Hamilton CountyIndiana18057226Providence CountyRhode Island44007225Brazoria CountyTexas48039225Richmond CountyGeorgia13245222Davidson CountyTennessee47037222Cherokee CountyGeorgia13057220Ventura CountyCalifornia06111218Data table shows the top 100 counties with the most Flock cameras. Click here to download the full data. Source: Pew Research Center analysis of 109,577 Flock ALPR nodes from OpenStreetMap (accessed Sept. 17, 2026). PEW RESEARCH CENTER Download the full county-level data for where Flock cameras are located These cameras are highly concentrated in urban areas. Roughly 80% of all cameras are in urban areas. The Atlanta and Houston metro areas each contain more than 4,000 Flock cameras, while Los Angeles, Chicago and Dallas-Fort Worth have more than 3,000 apiece. Flock cameras are also slightly more likely to be in lower-income neighborhoods than higher-income ones. But these differences are relatively modest, and Flock cameras exist in large numbers in communities with varying income levels and racial compositions. OpenStreetMap shows who owns or operates 12% of these cameras. Most cameras for which this information is available are operated by law enforcement agencies. How many public safety agencies use Flock cameras? The main tools for understanding how public safety agencies use Flock cameras are Flock’s transparency portals. These opt-in pages allow agencies to share information with the public about their Flock usage, as well as their policies for things like data sharing and retention. According to Flock, more than 1,500 agencies maintain a public transparency portal, although the company does not publish the full list. However, the organization EyesOnFlock tracks and compiles the information disclosed on these portals. As of Sept. 21, 2026, the EyesOnFlock database contains 1,517 agencies that have published transparency portals. All told, these agencies list 39,465 total cameras, which is 36% of all the Flock cameras listed on OpenStreetMaps. But this share varies greatly from state to state. In states like Virginia and California, the number of cameras listed in these agency transparency portals is very similar to the number listed on OpenStreetMap. But in others, these portals contain just a fraction of the total. For instance, just 6% of cameras listed on OpenStreetMap in Florida are accounted for in a transparency portal. And in Pennsylvania, that share is just 2%. This means that in some states, the vast majority of Flock cameras are officially disclosed as being owned by law enforcement. In others, this type of disclosure is much less common, so their ownership is murkier. What do these agencies disclose about their Flock usage? Agencies that choose to publish a Flock transparency portal can also choose what information to disclose. The vast majority of agencies with a transparency portal indicate how many total cameras they have (93%) and how long they retain the data their cameras collect (96%). Agencies using Flock cameras differ in what data they disclose % of law enforcement agencies with a Flock transparency portal that disclose … Source: Pew Research Center analysis of 1,517 agencies with public Flock transparency portals, as reported by EyesOnFlock (accessed Sept. 21, 2026). PEW RESEARCH CENTER Agencies using Flock cameras differ in what data they disclose % of law enforcement agencies with a Flock transparency portal that disclose … FieldPercent disclosedHow long they retain their data96How many cameras they have93How many searches they have made90Whether they share their data with other organizations66Information about individual searches50 Source: Pew Research Center analysis of 1,517 agencies with public Flock transparency portals, as reported by EyesOnFlock (accessed Sept. 21, 2026). PEW RESEARCH CENTER The median agency with a published transparency portal has 12 Flock cameras and retains its camera data for 30 days. This was the platform’s default data retention period until August of this year, when Flock lowered it to seven days. About two-thirds of these agencies disclose whether they share the data their cameras collect with other organizations. The agencies that disclose this information reported sharing their data with a median of 217 other organizations – primarily other law enforcement entities. Some states, like California, limit this type of data sharing. As such, California’s data sharing is largely contained within the state. But in states like Florida and Ohio, law enforcement agencies can share this data across dozens of other states. Why and how often agencies conduct Flock searches Through their transparency portals, public safety agencies also sometimes disclose their search activity, including logs of when each search was run and why. About half of the organizations in the EyesOnFlock database share any information about their searches, while the rest do not. The most common reason given for searches is simply some form of the word “investigation.” This was mentioned in 19% of searches where a reason was added. Flock recently replaced its open-text reason field with a drop-down menu and says it will require a case number on every non-emergency search by the end of the year. A USA Today investigation published in September requested raw search logs directly from 120 law enforcement agencies across 24 states. Those logs, spanning three-and-a-half years, showed that more than 200,000 users had conducted 75 million searches covering nearly 4 million unique license plates during that time. That’s about 59,000 searches per day.
What We Know – and Don’t Know – About Flock’s License Plate Cameras
Full Article
Original Source
Read the full article at Pewresearch →KhanList aggregates and links to publicly available news content. We do not host full articles from third-party sources. Always verify important information with original sources.