
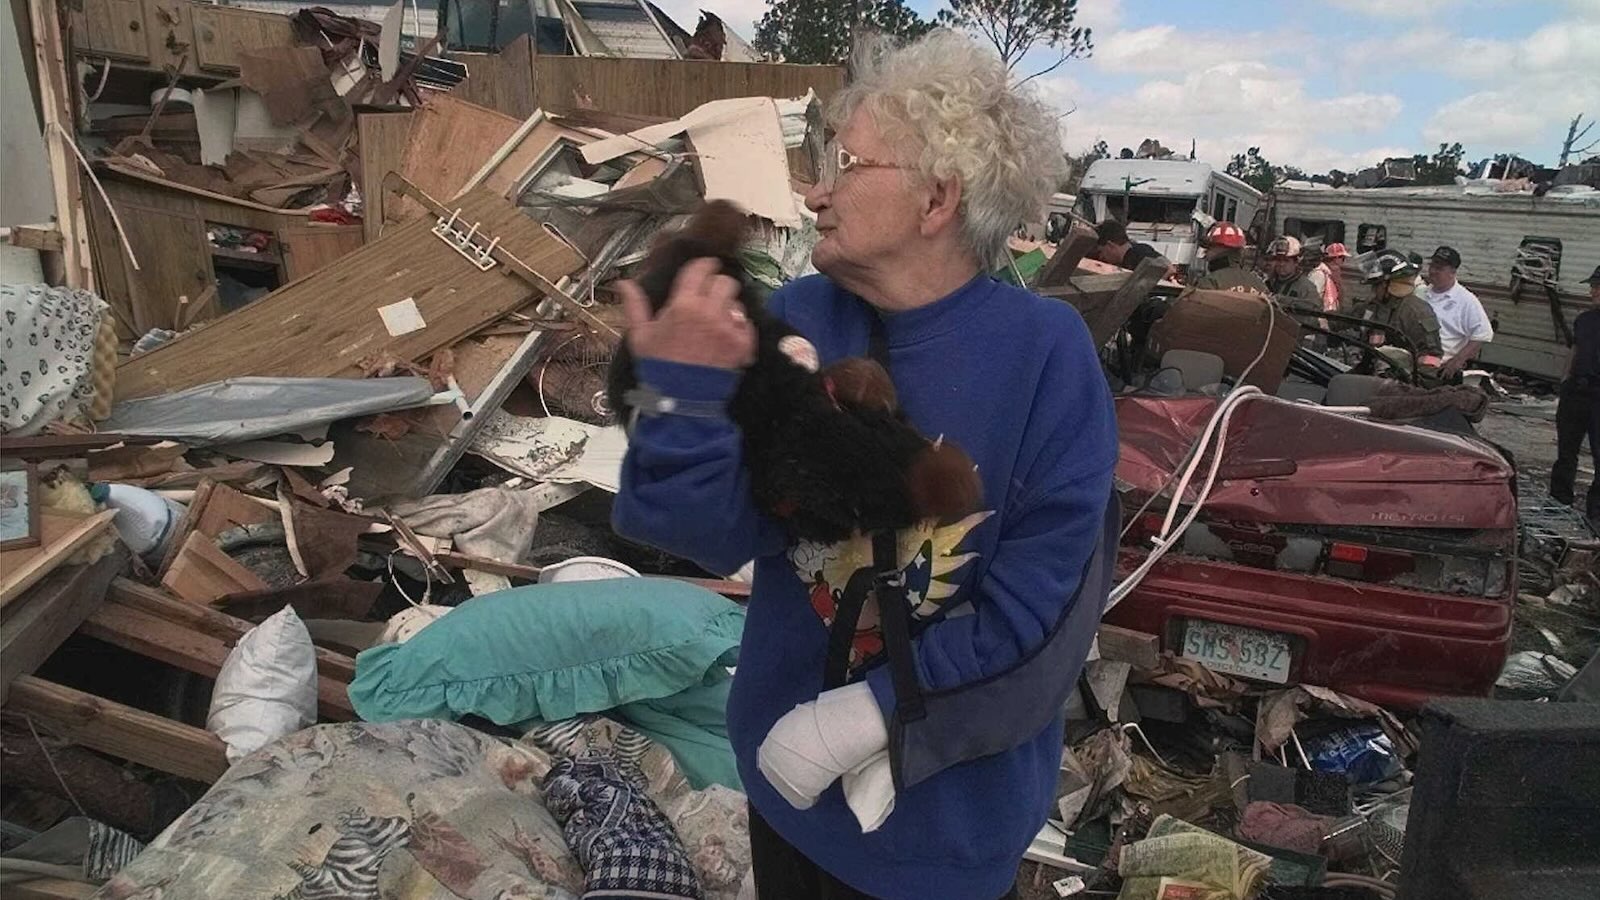
Overview: A cool, wet winter in the South is par for the course during El Niño, but a record-warm Gulf and Atlantic may boost the odds of extra-high tides and flooding rains (and could temper the hopes of East Coast snow lovers). For all the destructive power it can pack, a very strong (aka “super”) El Niño event like the one now in place also brings some measure of seasonal predictability. Nothing is ever guaranteed, but especially from late fall into early spring, El Niño shifts the odds of temperature and precipitation outcomes in ways that have distinctive regional fingerprints. This allows a wide range of stakeholders, from water managers to farmers to energy traders, to hedge their bets and reduce their risk of unpleasant surprises. The elephant in the room is the question of how human-caused climate change will affect this “super” El Niño. Figure 1. Typical features of El Niño across North America. (Image credit: NOAA) In the United States, El Niño’s classic winter signature (see Fig. 1) is drier-than-usual weather centered near the Ohio Valley, with unusual warmth extending across much of Canada and the northern U.S. tier. A wetter-than-usual arc typically runs from southern California across the Southwest and South and up close to the mid-Atlantic. A few areas in or near this typical moist arc have already been plastered with destructive flooding rains over the past several weeks, including Arizona and the Four Corners region as well as parts of Florida’s Space Coast and northern Georgia. Various factors, including El Niño, long-term warming, and unusually high monthly “king” tides, have already driven record-high coastal water levels this fall in California and Florida. There could be many more local and regional flooding episodes between now and spring 2027, especially if the typical El Niño–juiced jet stream sets up along the southern tier of the U.S. – an outcome implied in NOAA’s winter forecast (see Fig. 2) as well as recent runs of seasonal forecast models. There’s also historical and model-based evidence suggesting: a strikingly warm December for much of the U.S., but unusually chilly conditions that could emerge in February, particularly over the South a heightened risk of a major late-winter tornado outbreak, especially in Florida a sequence of potent nor’easter-type storms, but with major uncertainty over whether it’ll get enough for much snow along the Interstate 95 corridor. Figure 2. Outlooks for seasonal temperature (left) and precipitation (right) averaged across the three months of winter 2026–27 (December through February). (Image credit: NOAA) New ECMWF data shows the *strongest subtropical jet stream* in its forecast history blowing across the Pacific and U.S. this winter into next spring, with record-strength winds predicted from California to Florida.There's even a connection to Europe.El Niño fuels more… pic.twitter.com/geJ9ZVyLG1— Ben Noll (@BenNollWeather) November 6, 2026 Wet systems in this winter’s moist arc may have access to truly exceptional amounts of moisture, as our fossil-fuel-warmed climate continues to pump increasing amounts of water vapor (fuel for rainmaking systems) from ever-warming oceans into the atmosphere. According to analysis from the University of Arizona, sea surface temperatures have been at near-record warmth for early November when averaged across the Gulf of Mexico, and at levels smashing records by about 0.5 Fahrenheit (0.3 degrees Celsius) over the subtropical North Atlantic extending east from Florida. Read: Climate change plus a super El Niño could add up to a record-wet winter for California Of course, not every part of the moist El Niño arc will get inundated this winter. A few areas could end up on the dry side, while many places can expect recurrent wet periods with rains that end up being more generous than dangerous. Or at least that’s the hope of water users who’ve been struggling with widespread severe-to-exceptional drought. “The rain would be welcome for many areas that have had essentially no rainfall for most of the last couple of months,” said Pam Knox, extension climatologist with the University of Georgia, in an email. Nationwide, the percentage of the 48 contiguous U.S. states experiencing at least some level of drought dropped from a peak of 59% in September to around 44% as of November 3, according to the U.S. Drought Monitor. However, swaths of moderate to extreme drought persist across broad areas of the South from Texas to North Carolina. Knox and colleagues stress that the magnitude of El Niño’s impacts doesn’t necessarily increase in lockstep with the magnitude of El Niño itself. (The latter is formally defined by rolling three-month departures from seasonally averaged sea-surface temperature in the Niño3.4 region along the equatorial eastern Pacific). “The likelihood that we will experience wetter and cooler conditions somewhere in the Southeast is about eight in ten,” said Knox. “That does not necessarily mean that the impacts will be stronger, just more likely.”Emily Becker, now a research associate professor at the University of Miami, served as lead writer for NOAA’s widely read ENSO Blog from 2014 to 2025. In an email, Becker pointed to a distinction that often gets lost with this eye-popping El Niño event: while the sea surface temperature over the Niño3.4 region is hands-down far higher than anything on record at this point in autumn (see Fig. 3), the dynamics that drive El Niño’s far-flung impacts are shaped not just by the Niño3.4 reading itself but also by its interplay with other parts of the global tropics, which are themselves warming. Using a broader benchmark along these lines, NOAA’s new Relative Oceanic Niño Index (RONI), the current El Niño is firmly among the top events on record, but not head and shoulders above them. Figure 3. Daily calculations of average sea surface temperature over the Niño3.4 region (left) show recent values (blue trace) running 1-2 degrees Fahrenheit (0.5-1.0 degrees Celsius) above all other values on record for early November. When adjusted for overall tropical warming, the same temperatures – now shown as departures from the seasonal average (right), as in NOAA’s RONI index – are roughly on par with those in other “super” El Niño events, including November 1982 (tan), 1997 (red), and 2015 (gold). (Image credit: University of Arizona) “This event is currently about tied with 1997–98 for the atmospheric response,” Becker said. As a result, “we expect a stronger chance of typical El Niño teleconnections, but it’s harder to say if those impacts themselves will be more extreme.” One important wild card, Becker adds, is the record-setting Gulf and North Atlantic warmth: “Because warmer air can hold more moisture, global warming is likely to enhance El Niño’s precipitation impacts.” What the seasonal forecast models are saying Government agencies and private firms worldwide, including NOAA and the European Center for Medium-Range Weather Forecasts (ECMWF), have become increasingly adept at seasonal climate prediction. These outlooks are produced using atmospheric models similar to those run several times a day for routine weather forecasts, but with results calculated at lower spatial resolution. These climate models track the ocean, sea ice, and atmosphere, and they aggregate the results to capture monthly and seasonal averages. This’s a far more robust and reliable strategy than trying to predict chaotic day-to-day weather patterns months in advance. One outgrowth of this approach has been an increasing ability to foresee how El Niño and La Niña impacts could vary from month to month. These results often include a few classic outcomes together with quirks related to the distinctive state of the atmosphere and oceans as each event gets rolling. For example, it’s already looking like the widespread North American warmth often seen in December during El Niño could be even more extensive and intense than usual this year, though perhaps with the southern tier of the U.S. a bit cooler than average in typical El Niño fashion. Figure 4. Monthly temperature outlook from the North American Multi-Model Ensemble (NMME) for North America and adjacent oceans valid for December 2026, issued on November 9. The NMME includes a variety of U.S. and Canadian seasonal forecast models. (Image credit: NWS/NOAA Climate Prediction Center) “Super” El Niño events are especially prone to warm Decembers over the northeast half of the contiguous U.S., notes Eric Webb, a government meteorologist who’s carried out extensive personal research on El Niño climatology going back to the 1800s. The U.S. warmth that’s already characterized much of October and early November could be an early manifestation of what usually arrives by December, according to Webb. As he sees it, the fact that this year’s El Niño warm pool is focused especially far east in the equatorial Pacific – and thus especially close to the United States – makes its leverage on U.S. climate even more direct than usual. “So far this cold season, our El Niño has been generally on an accelerated timeline vs just about every other El Niño event in the modern era,” said Webb in an X thread on November 2. He added: “I think this speaks to how unusually strong & eastward shifted this El Niño is, even vs other Super Niños. The mid-latitude track is reaching maturity sooner w/ a stronger/more extensive Pacific & subtropical jet stream, advecting more mild air over N America in Oct & Nov.” If there’s one thing that stands out about this “Super” El Niño, it is how early & consistently we are going to the classic December “torch” pattern in N AmericaThe sheer strength & unusual eastward shift of this El Niño likely translating to a very early onset of this pattern pic.twitter.com/NJYSHbB0Js— Eric Webb (@webberweather) October 29, 2026 Sometimes this warmth can be remarkably persistent. At the U.K.’s University of St. Andrews, atmospheric scientist Simon Lee has led or co-led several recent papers that examine North American weather regimes, grouped into four main patterns, and how those regimes tend to unfold during particular winters. The most common regime during El Niño is the Pacific Trough regime, which pushes moisture into the West Coast and carries mild Pacific air across much of North America. “Severe cold-air outbreaks almost never occur during this regime,” said Lee in an email. Such weather regimes tend to last about 5 to 7 days. But during the “super” El Niño of 1997–98, the Pacific Trough persisted for over 40 consecutive days. This helped produce the warmest and wettest January-February period ever observed for the contiguous U.S. up to that point. This time around, most global forecast models predict wetter, but cooler-than-average conditions in January and February over the southern half of the contiguous United States, with unusual midwinter warmth swaddling most of Canada. This dovetails well with the textbook El Niño picture for those months. It remains to be seen how much of that rain will be gentle versus torrential. “I think it is reasonable to expect rain events during the winter in the Southeast on synoptic time scales (e.g., about every seven days),” said veteran forecaster Todd Crawford, vice president of weather and climate at Atmospheric G2. Crawford points to the 2015–16 El Niño as one of the three “super” events observed from 1950 through 2025. Much of Florida had its wettest winter on record in 2015–16. In Miami (see Fig. 1 below), close to 40% of the entire winter’s rainfall (December through February) fell in a single burst of 8.03 inches on December 3-5, while most of January and February saw rainfall of around 0.5 to 2.0 inches, each separated by about a week. Figure 4. Daily rainfall amounts at Miami International Airport during the “super” El Niño winter of 2015-16 (December through February). (Image credit: Atmospheric G2) Another consequence of this potent El Niño is a heightened risk of one or more late-winter tornado outbreaks, especially over the Florida peninsula, given that a turbo-charged subtropical jet stream can provide ample wind shear for severe storms. The National Weather Service office in Tallahassee, FL, found that between November and April, central and southern Florida experienced roughly twice as many tornadoes during El Niño as compared to both neutral and La Niña conditions. During the “super” event of 1997-98, 15 tornadoes scoured the landscape of central Florida, most of them on the night of February 22-23 (see photo at top). The severe weather took 42 lives, including 24 killed in Kissimmee by a destructive twister – originally rated F4 and later downgraded to EF3 – that remains the deadliest tornado in Florida history. The “super” El Niño of 2015-16 brought a more widespread outbreak on almost exactly the same calendar dates (February 23-24) across much of the Southeast. A total of 61 tornadoes were observed, including an EF3 that struck Pensacola, FL. Only seven people were killed, but there were 136 injuries, and the severe weather wreaked roughly $1 billion (2016 USD) in damage. This was the second most prolific February tornado outbreak in U.S. history. Will El Niño push snow and ice out of the U.S. picture this winter? As for the perennial autumn question of how much snow or ice might fall over the eastern U.S. this winter, a few key subtleties could make all the difference. Some winter-weather lovers are already dreaming of a reprise of the 2009–10 El Niño winter, which spawned the infamous “Snowmaggedon” February blizzard and several other major Northeast snowstorms. But both Crawford and Webb point out that 2009–10, though quite strong, was starkly different from most El Niño events, including the three “super” ones on record. “Most of the 2009–10 cocktail is absent this year,” said Crawford in his monthly U.S. outlook for Atmospheric G2 and The Weather Company. For one thing, a periodic reversal of stratospheric winds called the Quasi-Biennial Oscillation (QBO) was in a snow-favorable easterly mode in 2009–10. This time around, the QBO is forecast to be in a snow-unfavorable westerly mode, peaking near the start of winter. Moreover, as noted above by Webb, the El Niño warm pool is much further east this time than in 2009–10, and this seems likely to help push the system toward a more classic (i.e., less-snowy) outcome. Importantly, the planet has also seen 17 years of human-caused warming between 2009 and 2016. Overall, this has cut the risk of extensive, prolonged cold outbreaks toward the northeast U.S. – although research continues on whether some types of North American cold extremes might become sharper or more frequent as warming proceeds. It’s clear that sudden stratospheric warmings (SSWs) and the associated weakening of the stratospheric polar vortex are one key way to move cold surface air into place for big eastern U.S. snows. Scientists, including Judah Cohen (AER), have championed the thesis that heavy Siberian snows fed by open Arctic water can lead to a chain of events that favors polar-vortex disruption, SSWs, and cold/snow outbreaks in North America. There’s both theoretical and modeling evidence that SSWs are more likely during El Niño. Oddly, this hasn’t been the case during “super” events, as Lee notes: “In the three previous recent big El Niño winters (1982-83, 1997-98, 2015-16), the stratospheric polar vortex started the winter stronger than average, weakening through the season. None of these years saw a major [SSW].” It’s possible El Niño 2026-27 will buck this micro-trend. Seasonal forecasts show a much-increased likelihood of a major SSW by late winter, according to Lee. In line with this, several forecast models, including NOAA’s Climate Forecast System, are showing enhanced odds of colder-than-usual weather extending over much of the United States in February, with nearly all of Alaska and Canada still slathered in unusual midwinter warmth (see Fig. 4). Figure 4. Monthly temperature outlook from the North American Multi-Model Ensemble (NMME) for North America and adjacent oceans valid for February 2027, issued on November 9. (Image credit: NWS/NOAA Climate Prediction Center) Many eyebrows went up in late October when models began suggesting that the earliest SSW on record could take shape in November. The polar vortex is currently weaker than ever previously observed for early November, and a major SSW is expected to peak over the next few days. However, any impacts on U.S. weather will likely be muted. SSWs tend to be more powerful winter-weather-shapers over North America when they occur late in the winter, when there’s typically more snow cover over Canada to help generate frigid surface air that can flow south. (Moreover, as Lee notes, the coldest winter episodes in the eastern U.S. are usually driven by the Alaskan Ridge regime, which can push frigid air well south of Canada whether or not an SSW is present.) When there’s not an SSW in play, El Niño tends to produce high pressure displaced just far enough east to bring the U.S. East Coast lots of chilly, damp northeasterly flow but not as much frigid northwest flow. If February brings “just enough’ cold air and plenty of moisture,” says Crawford, “we absolutely should see a couple of mid-Atlantic/Northeast snows. Otherwise, I’d expect a lot of 40-degree heavy rainstorms.” This coming weekend (Nov. 14-15), a potent fall nor’easter could bring a substantial early-season snow to higher elevations and some interior parts of the Northeast, but most areas will get chilly rains. One startling outcome during the 1997–98 “super” event was a multi-billion-dollar series of devastating January ice storms centered on the far northeast U.S. and southeast Canada. Crawford doesn’t rule out such an event by late winter 2026–27: “I think the ingredients are certainly in place, given we expect high pressure of maritime polar origin in eastern Canada much of the winter. If we can ever build any snow cover in eastern Canada, we could get enough shallow cold air to bleed southward and really make things interesting.” Figure 6. Larry Songer of Brookville, Pa., a worker for Asplundh tree service, clears ice-covered branches near power lines in Watertown, N.Y., after an ice storm left a 2-inch-thick coating on Friday, Jan. 9, 1998. (AP Photo/Bill Sikes) The elephant in the room (and the ocean and atmosphere) There’s a not-so-secret sauce mixed into this winter’s El Niño: the atmospheric and oceanic effects of relentless human-caused climate change. According to Webb, the nonlinear jump in evaporation from an ever-warmer ocean may be helping the very biggest events, like this one, to go against the general principle that stronger El Niño events raise the odds of certain impacts but don’t reliably make those impacts more intense. “Very intense ‘super’ El Niños tend to account for a disproportionate amount of extreme ENSO-related impacts, like flooding,” Webb said. “This, of course, is only being exacerbated by long-term climatic changes.” Climate change could make ENSO itself less of a reliable tool for U.S. seasonal forecasting than it used to be, according to Lee. “We are dealing with a climate that is rapidly warming – much warmer than even just a decade ago – and a climate system that is now being ‘kicked’ by an extreme manifestation of natural variability,” he said. “While big ENSO events can help with predictability weeks to months ahead, the magnitude of this event set against a shifting background state means that, in some ways, it is harder to be confident in what will unfold in the next few months.” Or as Webb puts it: “It’s hard to fathom what an El Niño comparable to or stronger than 1997–98 would look like with about 30 years of climate change superimposed on top. I guess we’re about to find out.” Jeff Masters and Irene Sans contributed to this post. Republish our articles for free, online or in print, under a Creative Commons license.
What to watch for – and prep for – across the Southeast U.S. and Eastern Seaboard as El Niño peaks
Full Article
Original Source
Read the full article at Yaleclimateconnections →KhanList aggregates and links to publicly available news content. We do not host full articles from third-party sources. Always verify important information with original sources.