
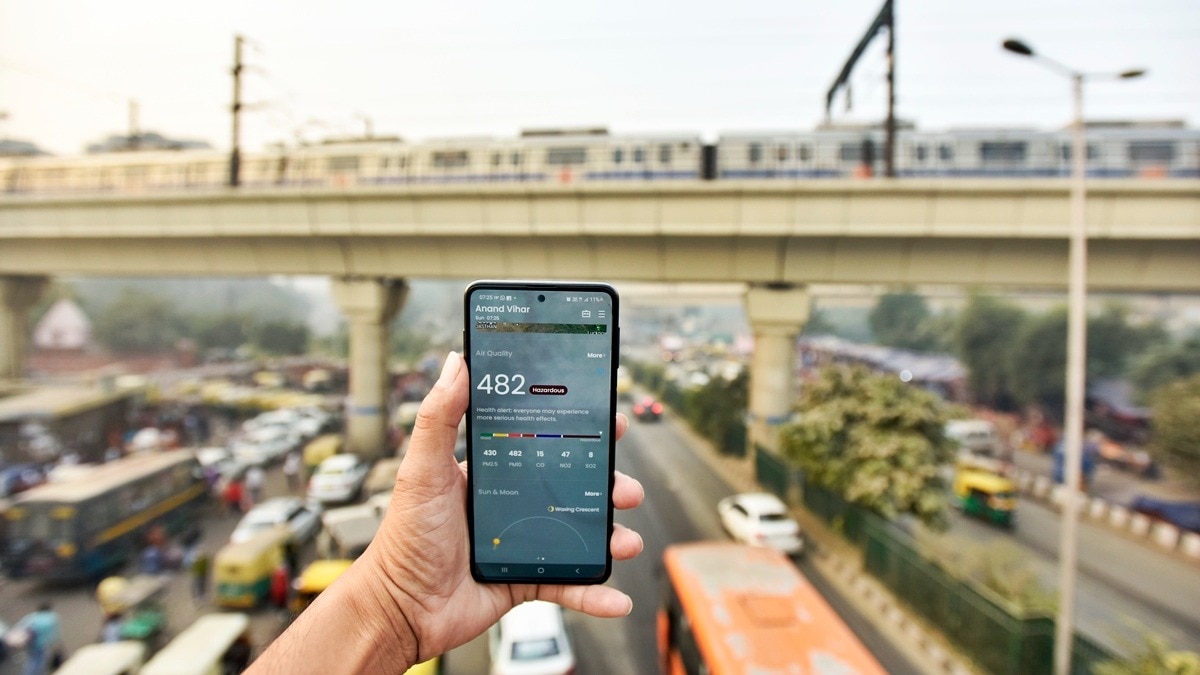
Delhi's air pollution reached alarming levels on Diwali night, but the numbers circulating online have left residents confused.While some reports and screenshots showed the Air Quality Index (AQI) crossing 1,300 and even approaching 2,000, official government data put Delhi's average AQI at 376 on November 8.So, was Delhi's AQI 500 or 2,000? The answer lies in how different platforms measure and calculate air quality.According to AQI.in, Delhi's AQI peaked at 1,331 at 1:31 am on November 9, following an overnight surge in pollution caused by firecracker emissions. The platform's historical graph showed the reading climbing above 1,000 around 11 pm before gradually declining. Other live screenshots and reports displayed even higher figures. However, the Central Pollution Control Board (CPCB), using India's National Air Quality Index, reported a citywide 24-hour average of 376 on Diwali. Several monitoring stations crossed 400, with Jahangirpuri recording 464 during the evening. These readings are not contradictory; they represent different measurements, averaging periods and AQI scales.WHY ARE THE NUMBERS SO DIFFERENT?The CPCB follows India's National AQI framework, which considers eight pollutants: PM2.5, PM10, nitrogen dioxide, sulphur dioxide, carbon monoxide, ozone, ammonia and lead. The concentration of each pollutant is converted into a sub-index using prescribed health-based breakpoints. The highest valid pollutant sub-index determines the overall AQI. The calculation generally uses 24-hour average concentrations, with eight-hour averages for carbon monoxide and ozone.India's AQI scale ranges from 0 to 500, with readings above 400 classified as severe. Therefore, a CPCB AQI reading of 1,300 or 2,000 is not possible within this classification framework.Platforms such as AQI.in also offer a US AQI option alongside India's AQI scale.These use different pollutant breakpoints and conversion methods. Their real-time readings can also capture sharp hourly pollution spikes rather than the CPCB's 24-hour city average. This is why figures can look dramatically different.So, what is the actual takeaway?Delhi's official average AQI of 376 was already in the very poor category, while several neighbourhoods experienced severe pollution.The much higher readings reported by third-party platforms reflect extreme short-term pollution levels on their displayed scales.An India Today ground investigation found that while monitoring stations recorded extremely high concentrations of particulate matter, public display screens at two locations were switched off or unavailable. Online dashboards, meanwhile, did not appear to reflect live changes during the team's checks.The important point is that whether the number is 376, 500 or above 1,000, Delhi's air remained dangerously polluted. The difference is in how the pollution is represented, not whether the health risk exists.- Ends
Was Delhi's AQI 2000, 1300 or 500 on Diwali night? Let me clear the air
Full Article
Original Source
Read the full article at Indiatoday →KhanList aggregates and links to publicly available news content. We do not host full articles from third-party sources. Always verify important information with original sources.