
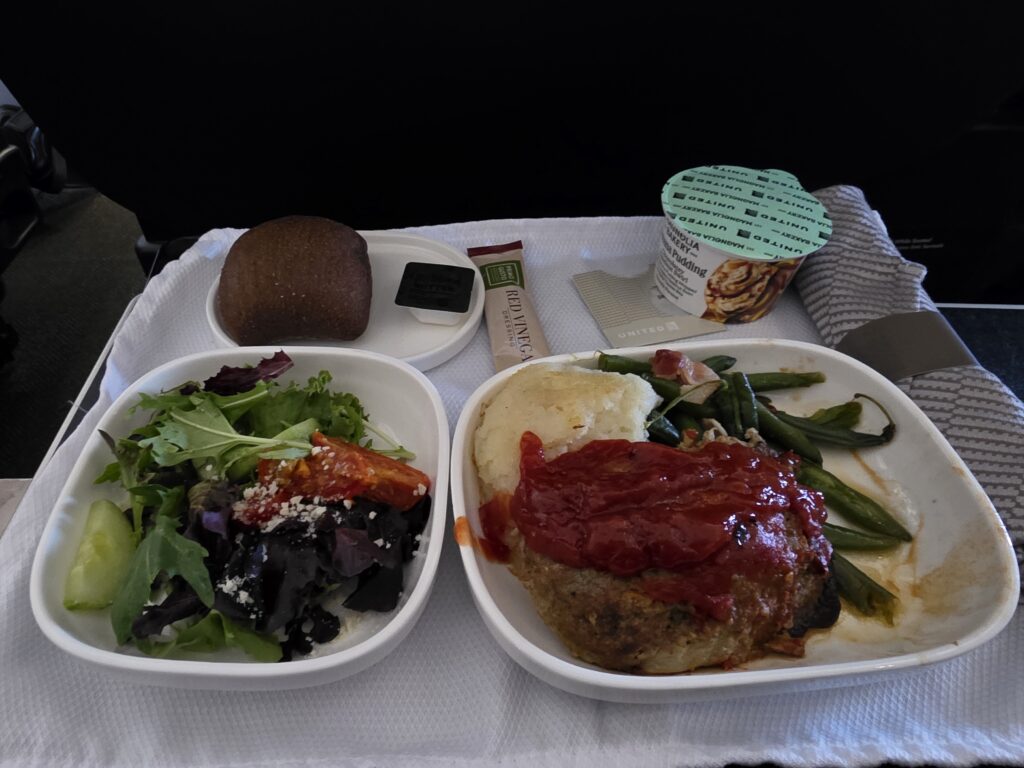
United reported spending $1.62 billion on passenger food last year, or about $11 per passenger. Delta’s bill was actually larger, at $1.66 billion, but spread across more passengers. But Delta spends more on domestic food than United does. Delta also spends more per passenger-mile. And I think Alaska serves better food than either of them. Adam Nathan put together an interesting comparison of airline food spending, arguing that United has improved while Delta has slipped. I reproduced his numbers from federal filings, expanded the comparison to 13 airlines, and broke out the regions. Airlines are spending more on food these days but it matters what flights you’re comparing. Adam Nathan’s airline food comparison United’s Denver Meatloaf What Airlines Report Spending On Passenger Food Here’s the comparison using the Department of Transportation’s Form 41 passenger-food expense and T-1 carrier-wide traffic summaries. These are nominal dollars per revenue passenger boarding, combining cabins and scheduled and charter service. A connecting traveler is counted again when boarding the next flight. Alaska and Hawaiian are separate, and regional affiliates aren’t included with the mainline carriers. I made some small adjustments compared to the tweet, though those numbers reproduce exactly. It turns out the source data here isn’t material to the rankings: Airline 2019 per boarding 2025 per boarding 2025 reported expense United $6.16 $11.07 $1.617 billion Delta $6.49 $9.99 $1.657 billion Hawaiian $6.62 $8.68 $100.6 million American $6.03 $7.96 $1.326 billion Alaska $5.35 $6.57 $233.8 million JetBlue $2.00 $4.39 $173.4 million Sun Country $1.46 $2.74 $13.5 million Breeze — $1.75 $10.7 million Spirit $0.08 $0.63 $20.0 million Allegiant $0.42 $0.60 $11.3 million Southwest $0.29 $0.45 $75.1 million Avelo — $0.14 $373,412 Frontier $0.33 About $0.001 $32,835 That Frontier number is interesting because the accounting separately provides for food and liquor sold onboard. And “Passenger Food” includes more than food: Beverages, outside catering charges and commissary supplies are included. So are food service uniforms and related communications expenses. The figures combine cabins. They aren’t the budget for an economy meal, a domestic first class tray, or a business class dinner. Meals for employees and meal vouchers for disrupted passengers are separate. These tables don’t identify lounge food spending. This is supposed to be onboard passenger catering. Southwest’s 45 cents fits an airline serving snacks and drinks rather than hot meals. It has no ovens, first class cabin or long haul meal service (yet!). The Herb Kelleher story I’ve told before captures the philosophy. Asked about giving passengers Snickers instead of peanuts, his response was, “Do you know what the difference in cost is between peanuts and Snickers?” United’s Lead Changes When You Compare Different Flights United’s average distance flown per passenger boarding was about 1,745 miles in 2025, compared with 1,410 at Delta and 1,336 at American. More long haul flying means more passengers getting meals, more second meals, and more business class dining. An airline can spend more per passenger without spending more on a given meal. Breaking out the reporting regions changes the picture. These are geographic expense allocations reported by each airline: 2025 expense per boarding American Delta United Domestic reporting entity $6.30 $8.06 $6.36 Atlantic $26.21 $25.37 $39.10 Pacific $39.49 $33.96 $43.38 Latin America $8.56 $10.94 $9.23 Delta reports the highest expense per boarding in the domestic entity. United leads in the Atlantic and Pacific categories. American’s Atlantic figure is slightly higher than Delta’s even though American’s overall average is lower. Another way to allow for flight length is spending per 1,000 passenger-miles: Delta $7.08, United $6.34, American $5.96. That still doesn’t control for cabin mix, the number of meal services, or the cost of catering at different airports. American Airlines First Class, Los Angeles – Sydney United’s increase over time is significant, rising from $717 million in 2019 to $1.617 billion in 2025 (up 125%). With more passengers, the increase per passenger was about 80%. Its average distance per boarding actually shortened over that period, so longer flights aren’t driving the increase. General consumer prices rose about 26% over those six years. So inflation-adjusted the per-passenger increases are about 43% at United, 22% at Delta and 5% at American. I previously covered United chief financial officer Mike Leskinen asking how to measure the return from better chicken. United’s October 2025 earnings release said it was spending 25% more on food, had invested $85 million in its food and beverage program, and had another $45 million allotted for 2026. Alaska’s Food Is Better Without The Biggest Budget I’ve written about getting a better breakfast on Alaska between Seattle and Austin than in American’s first class from Los Angeles to Sydney. The Alaska burger is better than peers, too. Alaska Airlines Breakfast Alaska Airlines Burger Officers’ Tuesday lunch meetings in the early 2010s featured the airline’s onboard food. The executives were eating their own dog food, as it were, week after week. That came even before the Virgin America acquisition and Virgin America did a good job with meals. Foreign Airlines Disclose More About Meal Spending Some foreign airlines publish detailed accounting of their onboard food spend. Reported category 2019 per passenger 2025 per passenger Increase Emirates: inflight catering-related costs US$16.35 US$24.07 47% Singapore Airlines group: inflight meals S$15.25 S$18.83 23% Turkish Airlines group: passenger services and catering US$8.39 US$12.70 51% Emirates’ 2019 and 2025 reports show catering-related expense growing from 3.519 billion to 4.746 billion dirhams. The latest report attributes its increase over the preceding year to more premium passengers, improved offerings and higher cost per meal. Singapore’s 2019 report and 2025 results disclose group inflight meal expense. Turkish actually publishes its broader per-passenger measure in its 2019 and 2025 investor presentations. Cathay Pacific Balik Salmon and Caviar Airport Lounges May Spend Less On The Food Than You Think The best windows into lounge spending often come from airport contracts, rather than airline annual reports. And airline lounges often don’t go through a detailed RFP process, since signatory airlines to an airport use and lease agreement just have the lounge space treated under that broader agreement. I recently reported that The Club’s Seattle lounges spent $3.54 per guest on food and drinks. Priority Pass paid about $24 per visit, while airline-contracted visits brought in about $35. The proposal for Chase’s LAX lounge budgeted $8.40 per guest for food and beverages. That’s a forecast for that location, and the figures have probably risen over the past five years. Chase Sapphire Lounge DFW Look at the LAX proposal’s second operating year: Staffing: $8.45 million. Airport concession fee: $6.30 million. Other operating costs: $3.05 million. Food and beverages: $2.53 million. Food and drinks account for about one-eighth of that $20.33 million budget before depreciation. Staffing costs more than three times as much as food and beverage. Capital One Landing DCA Shrimp Capital One Landing DCA Pastries I’ve had excellent food at Chase’s Dallas lounge. An average food budget can support a good meal because some guests only have coffee, and an ingredient budget isn’t a restaurant menu price. In the LAX proposal, adding another $2 per guest to food would increase the food budget by nearly 24%—but the overall cash operating budget by only about 3%. Topics on this page
United Airlines Food Spending Up 80% Per Passenger—Overtaking Delta
Full Article
Original Source
Read the full article at Viewfromthewing →KhanList aggregates and links to publicly available news content. We do not host full articles from third-party sources. Always verify important information with original sources.