
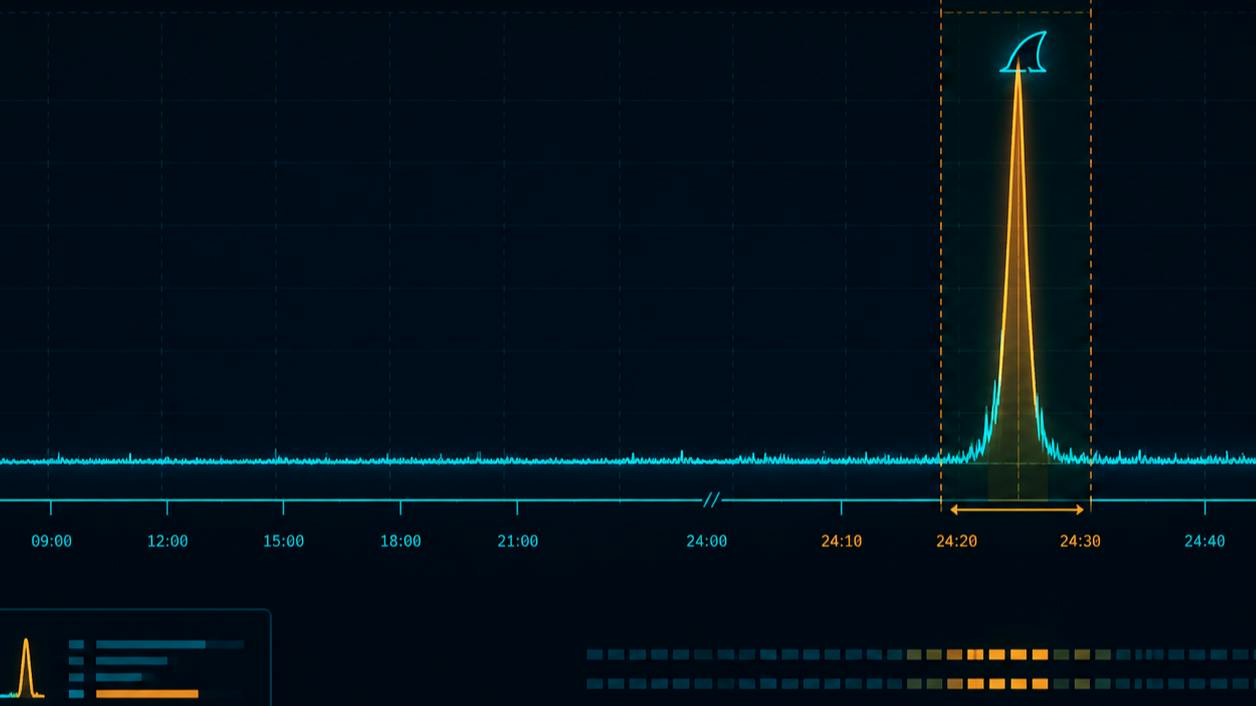
The QuestionMy last writeup ended with a confirmed finding: a TLS-wrapped tunnel to 178.62.245.11, alive for over a day, carrying an estimated 84MB out of a compromised host. tcpdump proved the tunnel existed. tshark answered the harder questions: how much data actually moved, when it moved — a steady drip, or a burst — and whether this was one continuous session or two.tcpdump tells you a conversation exists. It doesn't tell you what's inside it, how it behaved over time, or whether "one tunnel" was really one tunnel. For that I used tshark as a three-stage chain: filter to isolate the traffic, extract to pull structured detail out of it, and stats to answer questions about volume and time. I ran the chain on a clean sample first to get the syntax right, then pointed the same commands at the real evidence. Here's what each stage does, and what it found.First, get the map — protocol hierarchyBefore filtering anything, the first command on any unfamiliar capture should be -z io,phs — it dumps a nested tree of every protocol present and how many frames and bytes belong to each layer:bashTZ=UTC tshark -r dmz.pcap -q -z io,phs frame frames:216883 bytes:259498077 ip frames:207374 bytes:259094303 tcp frames:207035 bytes:259050823 http frames:19108 bytes:34899659 tls frames:57717 bytes:116848130 tls frames:666 bytes:12747630 That single command tells you the shape of the whole file before you write a single filter: TLS is the dominant protocol here by a wide margin — 116.8MB across 57,717 frames, more than three times HTTP's footprint. The nested tls → tls line matters too: it means 666 of those frames are full application-data records riding on a completed handshake, not just abandoned handshake attempts. That's your first clue the tunnel is worth chasing before you've even looked at an IP address.One habit worth building before any of this: unlike Wireshark's GUI, tshark won't silently reorder out-of-sequence packets. If a capture was merged from multiple interfaces, frames can land slightly out of chronological order — and every timestamp-dependent finding below (the burst window, the eight-minute gap, the bucket math) depends on frame.time_epoch being monotonic. A quick check costs nothing:bashtshark -r dmz.pcap -T fields -e frame.time_epoch | sort -c -n No output means the file is already in order. If it flags disorder, run Wireshark's reordercap utility first to produce a sorted copy, then redo the analysis against that file instead of the original.Filter — isolating signal from noisetshark's display filters (-Y) use the same Wireshark filter language whether you're reading a clean sample or 217,000 packets of mixed traffic. Start narrow:bashtshark -r infer.pcap -Y "http.request" tshark -r infer.pcap -Y "tls.handshake.type == 1" The second filter isolates TLS Client Hellos — the one packet per handshake where the client tells the server what domain it thinks it's connecting to, even though everything after that is encrypted. That's the SNI extension. On the clean sample:9323 159.65.251.18 → 104.19.174.68 Client Hello (SNI=repos-droplet.digitalocean.com) 12808 159.65.251.18 → 199.232.38.49 Client Hello (SNI=cdn.fwupd.org) 12856 159.65.251.18 → 199.232.38.49 Client Hello (SNI=cdn.fwupd.org) Three handshakes, three visible domain names, right in the summary line — background OS-update and firmware-CDN traffic that has no reason to hide what it's connecting to.Running the same filter against the real tunnel:bashTZ=UTC tshark -r dmz.pcap -Y "tls.handshake.type==1 && ip.addr==178.62.245.11" One early lesson worth stating plainly: on a multi-day capture like this one, timestamps render in your shell's local timezone by default. TZ=UTC on every command touching this file isn't optional — get it wrong once and your whole timeline shifts by hours.A filtered view is still just packets scrolling past. -T fields turns matches into data you can actually compare:bashTZ=UTC tshark -r dmz.pcap -Y "tls.handshake.type==1 && ip.addr==178.62.245.11" -T fields \ -e frame.number -e frame.time -e ip.src -e ip.dst -e tcp.dstport \ -e tls.handshake.extensions_server_name \ -E header=y -E separator=, -E quote=d Three Client Hellos came back:frame.number,ip.src,ip.dst,tcp.dstport,tls.handshake.extensions_server_name "49415","192.168.50.43","178.62.245.11","11601", "184343","192.168.50.43","178.62.245.11","11602", "184467","192.168.50.43","178.62.245.11","11602", All three have an empty SNI field.Compare that to the clean sample, where every background connection carried a real domain name. A direct TLS connection to a bare IP with no SNI isn't proof of anything on its own — plenty of internal or custom services skip it too. But it's an unusual indicator. Combined with everything else already known about this host — the confirmed CVE-2025-24813 entry point, the malicious Splunk app, the destination IP itself — it adds weight to a case that doesn't rest on this one detail alone.Stats — the question that actually matteredThis is where I learned the most expensive lesson of the investigation, so I'm including the dead end along with the answer.The obvious move is tshark -r dmz.pcap -q -z conv,tcp, scoped to the tunnel IP. Scoping it correctly took some trial and error. Passing a filter through -Y while also requesting -z conv,tcp doesn't reliably narrow the stats table in every tshark build, and I burned real time chasing that. The fix was a more reliable pattern: dump the full table to a file, then grep for the IP directly.bashTZ=UTC tshark -r dmz.pcap -q -z conv,tcp > /tmp/dmz_conv.txt grep "178.62.245.11" /tmp/dmz_conv.txt Eleven conversations matched. The two that mattered:192.168.50.43:55148 178.62.245.11:11601 34721 7,640kB 35625 86MB 70346 94MB start=90494.08s dur=93758.82s 192.168.50.43:52736 178.62.245.11:11602 14784 4,281kB 14686 18MB 29470 23MB start=184713.26s dur=5416.18s PortTotal bytesRelative startDuration1160194 MB90,494s93,759s (~26 hrs)1160223 MB184,713s5,416s (~1.5 hrs)That's already an upgrade on the original estimate — 117MB total, not 84MB — and confirmation of two distinct sessions, not one. The gap between them: 11601's last packet lands around relative 184,253s; 11602 opens at 184,713s. Under eight minutes apart. Not a cold restart days later — a near-immediate failover.Here's where I almost published the wrong story. I ran io,stat,1800 to look at volume over time and got a 30-minute window claiming 161MB — more than the entire session's reported total. That's not possible, and it should have stopped me immediately rather than nearly making it into a draft. The cause: io,stat's bucket boundaries are computed against relative capture-start time. Cross-checking that bucket against a wall-clock filter compared two different windows entirely — they only looked aligned by coincidence.The fix was to stop trusting the built-in aggregation and build the time series by hand:bashTZ=UTC tshark -r dmz.pcap -Y "ip.addr==178.62.245.11 && tcp.port==11601" \ -T fields -e frame.time_epoch -e frame.len > /tmp/tunnel_frames.txt awk '{bucket=int($1/1800); bytes[bucket]+=$2} END {for (b in bytes) print b, bytes[b]}' \ /tmp/tunnel_frames.txt | sort -n Extract the raw timestamp and length for every matching packet, bucket them in awk ourselves, and the totals are guaranteed to add up to the real session total — no ambiguity, no built-in aggregation to second-guess.The real shape, once trustworthy, reading straight off the bucketed output:986462 52186 986463 52242 986464 52440 986465 52230 986466 52428 986467 1679397 986468 81211014 986469 4311415 986470 1657474 Every bucket before 986467 sits in that same tight ~52,000-byte band — dozens of them, not a handful. Then three buckets in a row break the pattern entirely: a ramp-up, a 30-minute window at over 81 million bytes, and a ramp-down. Converting bucket 986468 back to a timestamp (date -u -d @$((986468*1800))) pins it exactly: 2026-04-08, 10:00–10:30 UTC.In plain terms:2026-04-06 ~07:59 UTC → 2026-04-08 ~09:30 UTC — a near-metronomic ~52KB every 30 minutes. Over 25 hours of this. Consistent with beaconing, not data theft.2026-04-08 10:00–10:30 UTC — 81.2MB in one 30-minute window. The actual exfil.Ramp-down over the following 30 minutes, then the session ends.11602's shape is the inverse. Running the same bucketed extraction on port 11602:986470 15126046 986471 3034862 986472 4563296 986473 376072 No beacon phase at all. It opens at 11:00 UTC already mid-transfer — 15.1MB in its first half hour — then declines steadily: 3.0MB, then 4.5MB, then 376KB, over the next ninety minutes before closing. This is an inference rather than a confirmed fact, but the shape is suggestive. Where 11601 spent a day waiting before moving, 11602 came up already carrying data — more consistent with a resumed transfer than a fresh implant restarting its beacon cycle.So the honest answer to all three of my IR lead's questions: 117MB total. Almost all of it inside a two-hour window — 10:00 to 13:00 UTC on April 8 — bracketed by 25+ hours of near-silent check-ins beforehand. Two sessions, reconnecting within eight minutes of each other.Detection / Blue-Team NoteEverything above was done by hand, after the fact, against a file already on disk. A SOC doesn't get that luxury — but the same signal is available in real time if you're watching for it.Byte-volume-over-time, the exact metric the io,stat rebuild produced, is precisely what egress monitoring and DLP tooling baseline against. A host that's moved a steady 50-100KB every half hour for a day, then suddenly moves 80MB in the next thirty minutes, is a textbook anomaly. NetFlow volume alerting, a Zeek conn.log threshold rule, or a SIEM correlation on bytes-out percentile spikes would all have caught this moment — not the day of beaconing before it.The missing SNI is a second, independent signal worth alerting on. TLS connections to external IPs with no server_name extension are unusual enough in most environments to be a low-noise detection — legitimate outbound TLS to commercial services almost always carries SNI for virtual hosting. A direct-to-IP TLS handshake without it is a small but specific tell.Both of these are things a manual packet read can find once, but they're far more useful as continuously running detections than as a one-time finding in a pcap — which is exactly the gap the next tool in this series is built to close. Zeek generates conn.log entries — byte counts and duration per connection — automatically, for every connection, all the time, instead of needing someone to hand-build the bucketing in awk after the fact.
Tracking 117MB of Data Exfiltration Across Two TLS Sessions
Full Article
Original Source
Read the full article at Hackernoon →KhanList aggregates and links to publicly available news content. We do not host full articles from third-party sources. Always verify important information with original sources.