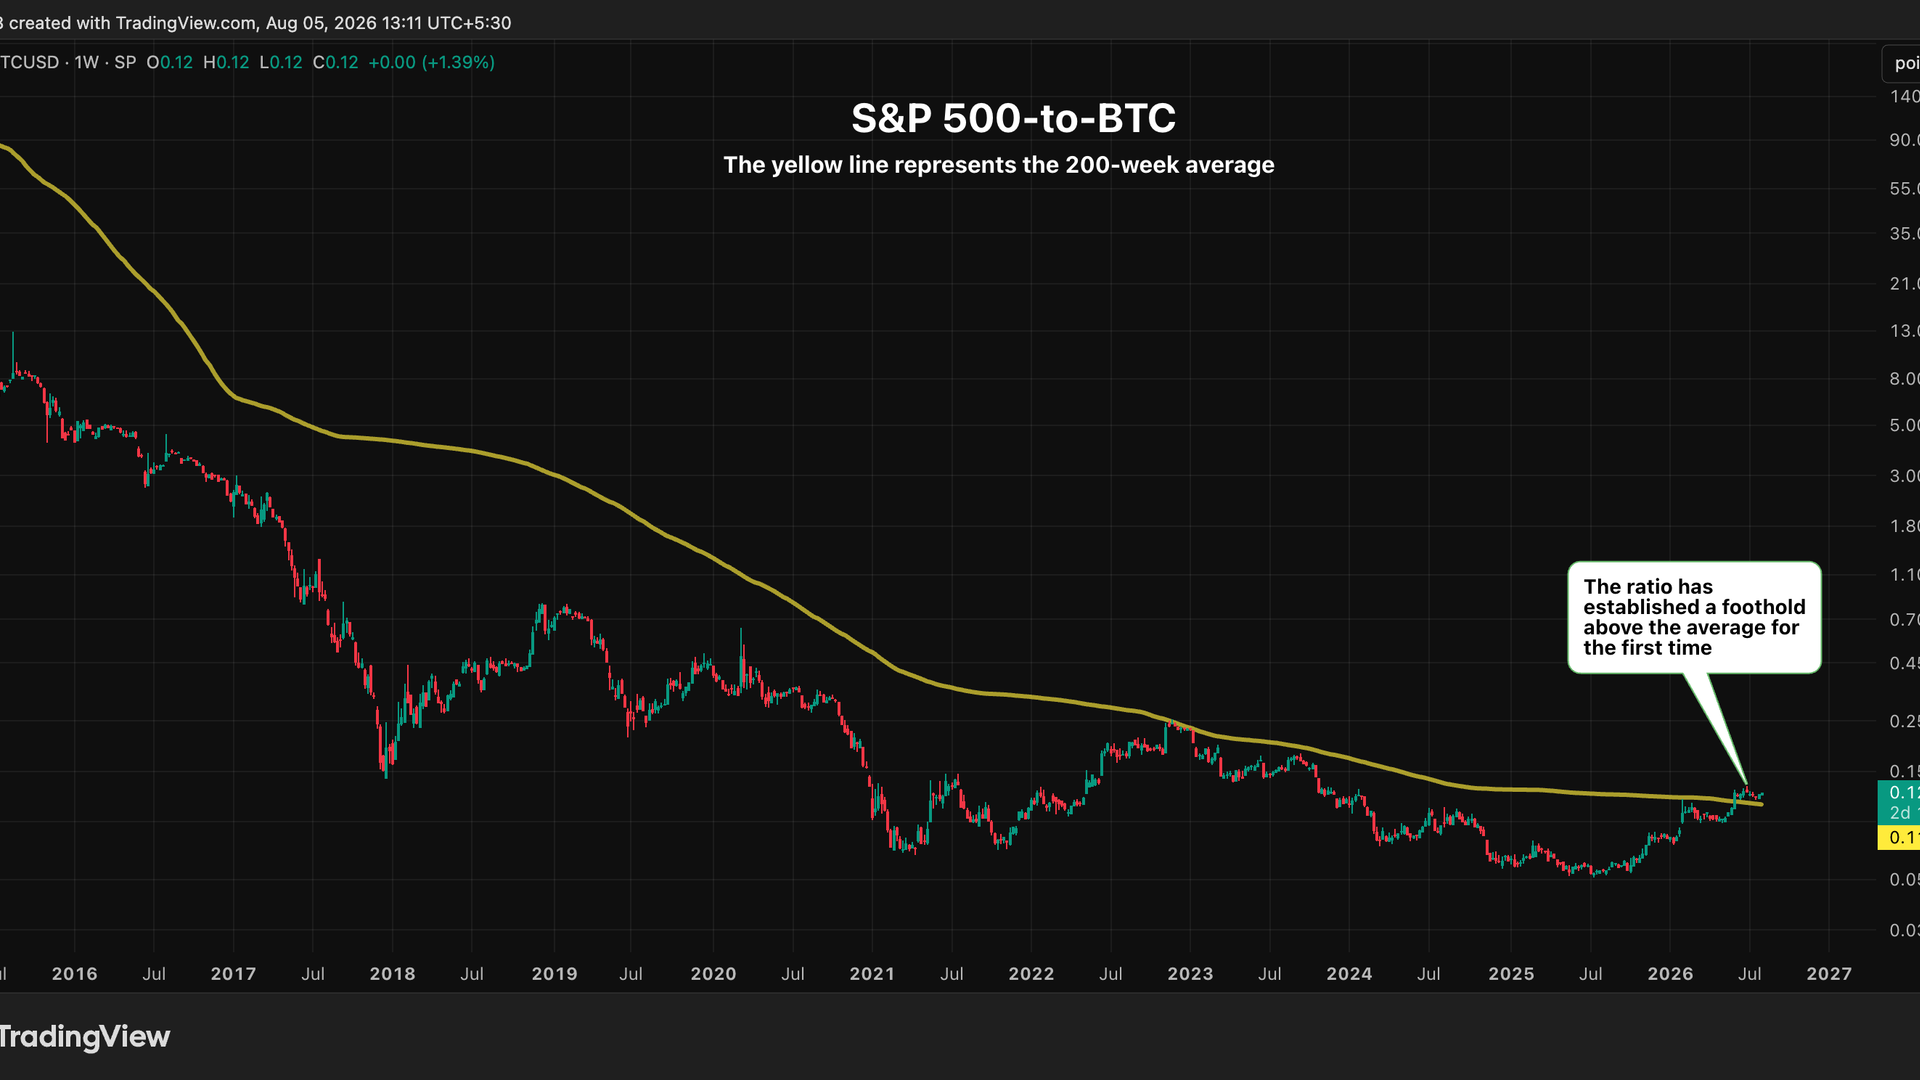
The worst chart for bitcoin bulls right nowFor 14 years, one ratio moved only in bitcoin's favor. Now it has decisively turned the other way and bulls may not like what it means.Updated Aug 5, 2026, 8:11 a.m. Published Aug 5, 2026, 7:54 a.m. The S&P 500-to-bitcoin ratio has topped its 200-week average for the first time. (TradingView)The S&P 500 and Nasdaq, priced in bitcoin, just broke above their 200-week moving averages for the first time since 2012, a level that's capped every prior stock rally against BTC.The shift raises suggests that days of parabolic BTC gains may be behind us. For years, bitcoin BTC$64,196.50 trounced stocks and most other assets, and supporters pointed to the outperformance as proof the largest cryptocurrency was also the best store of value. Now, one chart suggests that edge may be fading.That chart is the S&P 500-to-bitcoin ratio, which measures how much bitcoin it takes to buy the index. Today it takes roughly 0.12 BTC, down from more than 300 BTC in 2012. The ratio has generally dropped since BTC’s inception in 2010, with the 200-week simple moving average, a barometer of long-term trend, acting as a ceiling. There were brief instances of stocks outperforming BTC, lifting the ratio, but never beyond that average.Until now.In recent weeks, the ratio hasn't just topped the 200-week average, it's established a firm foothold above it, clearly visible on the far right of the chart. The behavior is not isolated to the S&P 500, either. The Nasdaq/BTC ratio is showing the same first-ever crossover above the 200-week average. That’s exactly why this chart may be painful for bulls. The fact that the break above the key average has held and hasn’t reversed quickly suggests bitcoin’s era of outsized rallies versus equities has probably ended. If that’s the case, the “superior store of value” narrative could start to lose its edge.For macro traders, a stocks-to-bitcoin ratio that no longer moves decisively in favor of BTC undercuts the cryptocurrency’s appeal as an asset capable of single-handedly lifting a portfolio higher. It also cuts against the more aggressive forecasts for the next bull cycle, predicting prices at $300,000 or higher. These largely extrapolate from prior cycles, when bitcoin's small size let it multiply many times over in months. There is a more constructive read of the situation, and it’s about bitcoin growing up. Moonshot rallies are a young-asset phenomenon when liquidity is thin and a handful of buyers can move the small market 10-fold in a year. That's harder to repeat once an asset is worth over a trillion dollars and trades alongside spot ETFs, options, futures and structured products. In other words, the same plumbing that has made bitcoin easier to buy has also made it harder to move violently.12345678910The Evolution of the Crypto CEX Landscape: A Case Study on BinanceThe Evolution of the Crypto CEX Landscape: A Case Study on BinanceBinance remains crypto’s leading exchange, expanding from spot and derivatives into RWAs, payments, savings, yield, and broader financial services.Binance remains crypto’s leading exchange, expanding from spot and derivatives into RWAs, payments, savings, yield, and broader financial services.Why it matters:Binance remains crypto’s leading exchange, expanding from spot and derivatives into RWAs, payments, savings, yield, and broader financial services.View Full Report
The worst chart for bitcoin bulls right now
Full Article
Original Source
Read the full article at Coindesk →KhanList aggregates and links to publicly available news content. We do not host full articles from third-party sources. Always verify important information with original sources.