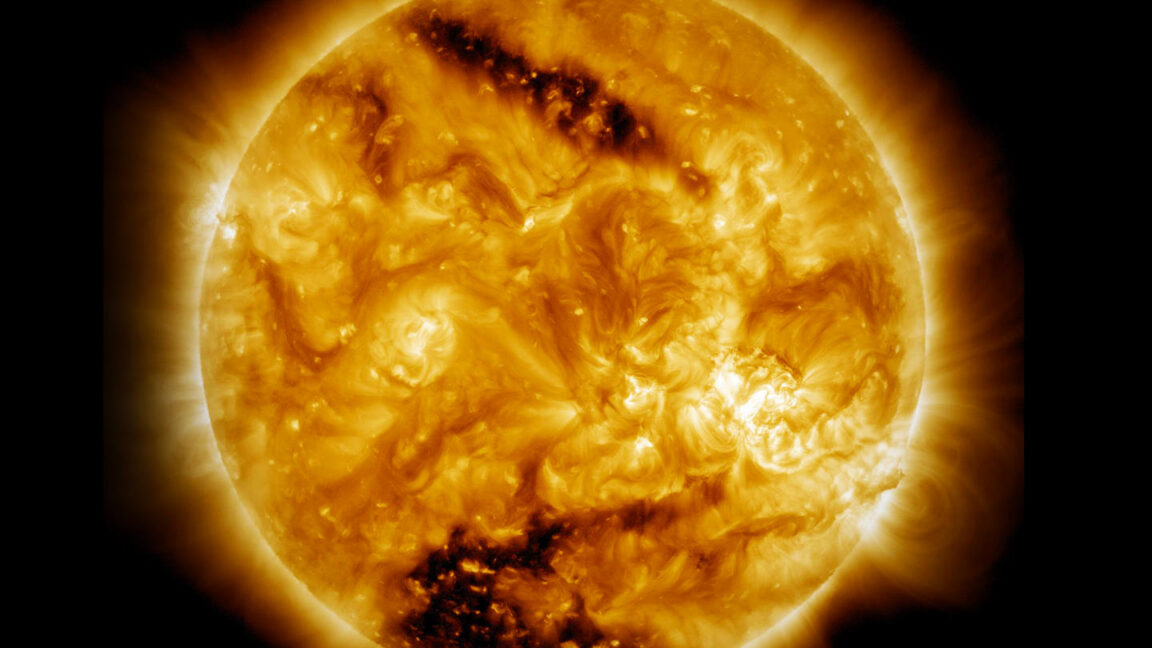
We expected them to be there, but they had previously been too small to see. Wherever two fluids slide past each other at different speeds, the boundary between them buckles, then curls, then rolls up into vortexes. It’s called the Kelvin-Helmholtz instability, and the physics behind it was worked out in the late 1860s. We know this instability explains why wind causes ripples on the surface of water and clouds shear into a row of curves. For decades scientists argued the same thing must be happening with plasma on the surface of the Sun, and yet nobody had been able to confirm it. Now, a team led by David Kuridze and Friedrich Wöger of the National Solar Observatory reports that Kelvin-Helmholtz instabilities are not just visible on the Sun, but they’re ubiquitous. Their new study proposes that this may change the way we think about how heat, mass, and magnetic energy move through the Sun’s atmosphere. Telescope’s test drive The reason plasma whirlpools on the Sun stayed hidden for so long is rather trivial: they are very small. Their scale sits below what telescopes with mirrors smaller than 2 meters can resolve. For most of the history of solar physics, that has ruled out every telescope on Earth. This changed when the US National Science Foundation opened the Daniel K. Inouye Solar Telescope, a 4-meter instrument in Hawaii and the largest solar telescope in the world. The telescope entered its operational phase back in November 2021. During a three-minute window on April 14, 2025, Kuridze’s team pointed it at an active region near the center of the solar disk and recorded images at a wavelength of 416 nanometers using a diagnostic camera setup built jointly by the National Solar Observatory and the Max Planck Institute for Solar System Research. They were not looking for vortexes, though. “The main goal was to achieve diffraction-limited performance with the telescope,” Kuridze says. Every telescope has a diffraction limit, the finest detail its optics can physically deliver. It’s set by two things: the size of the mirror and the wavelength being observed. The bigger the mirror and the shorter the wavelength, the finer the detail we can observe. The mirror at the Inouye telescope was fixed at 4 meters, so the team pushed on the wavelength. “416 nanometers is towards the smaller portion of the visible spectrum,” Kuridze says. “We selected it because we wanted to achieve a higher diffraction limit and higher resolution.” What they got in the end, though, was something more than just a cool test drive. The camera read out 740 frames per second with exposures of 100 microseconds. Two thousand of those frames were combined into a final image using a technique called multi-frame blind deconvolution, which numerically models and removes the blurring left over by Earth’s atmosphere after the telescope’s optics have done their work. The result was a movie of the solar surface with a new frame every two seconds and a spatial resolution of about 19 kilometers—right at the theoretical limit of what a 4-meter mirror can do at that wavelength. “As a byproduct we got these amazing observations, which allowed us to see something which has never been seen before,” Kuridze says. Vortex structures At 416 nanometers, the solar surface is dominated by granules, the convection cells that carry heat from the interior. They’re interlaced with concentrated bundles of intense magnetic fields. In lower-resolution images, the interface between a bundle of these magnetic fields and the surrounding granulation looks smooth and slightly blurry. In the DKIST data, it looks nothing like that. The interfaces are composed almost entirely of vortex-like structures and fine dark striations. The team identified 47 of these vortex-bearing interfaces in the telescope’s field of view and measured the spacing between adjacent curls. It turns out they’re usually between 60 and 100 kilometers apart, with individual vortexes measuring from 25 to 170 kilometers in diameter. The smallest ones scientists could spot sat right at the 19-kilometer resolution limit, which means we don’t know how far down in size they go. Tracking how fast they grow, the team established they could double their size in under a minute. The vortexes also propagated along the interfaces at speeds between 0.67 and 3 kilometers per second. For the observer hovering above one of these boundaries, Kuridze says, the view would depend on the time of arrival. The instability runs through two phases. “The first is the linear phase, when things are more relaxed, very well organized, regular and beautiful,” he says. “If you see them from close range you will see something like cloud-type things, which are rolling.” But when the peaceful phase is over, it’s chaos. “At some point everything turns into a non-linear regime and then things get messy,” Kuridze explains. “You are basically getting turbulence—very chaotic turbulence. Why do the curls form at the interfaces and not elsewhere? That’s due to the direction the magnetic field is pointing. Magnetic field lines act a bit like elastic threads running through the plasma, and they resist being bent. When those threads lie along the direction of the flow, they pull a rippling boundary back, which flattens and suppresses the instability before it can grow. When they run across the flow, they do nothing to stop it. In the strong magnetic regions DKIST observed, the field points almost straight up out of the surface, while the granular flows sliding past it move sideways. The threads are strung the wrong way to hold the boundary together, so the curls grow with nothing to limit them. Double-checking Because Kuridze, Wöger, and their colleagues saw something nobody has seen before, they made sure the observation wasn’t just an artifact of image processing. “Everything looked like it should be Kelvin-Helmholtz, but of course this is not enough,” Kuridze says. “You need theoretical proof to make sure that it is really Kelvin-Helmholtz.” To get that theoretical proof, researchers ran computer simulations modeling a patch of photosphere roughly 6 megameters on a side at a grid spacing of 3.2 kilometers, seeded with a magnetic field map of the actual observed region. Then, they synthesized images that the DKIST should have registered while looking at this simulated patch. The team computed 500 spectral points across the observed wavelength band, applying the transmission profile of the real interference filter and blurring the result to match the real telescope’s resolution. The synthetic images accurately reproduced the vortexes’ appearance and dynamics, including growth rate, distribution, and propagation speeds, which led the team to conclude their observations are most likely real. And so are the consequences. Unexpected stir A strong magnetic field normally holds plasma still. That’s essentially what a sunspot is: a patch where the field is strong enough to choke off convection, leaving the surface dark and cool. Finding an instability that spins up vortexes along the edge of every magnetic element means finding a stirring mechanism where none was expected to exist. That means magnetized and unmagnetized gas can blend into each other; cool material from the edges of the convection cells can leak into the magnetic regions, altering how heat moves just beneath the visible surface. Our existing models of solar convection do not account for this. Then there is the corona, the Sun’s million-degree outer atmosphere. It is heated partly by field lines being shuffled at their anchor points until they braid into tangles that eventually snap and release energy. The problem is, we have never observed the mechanism responsible for this shuffling. “You have these twisting motions everywhere at the surface of the magnetic element, and this twisting motion is nothing else than braiding of the magnetic fields,” Kuridze says. So far, though, all of this rests on a three-minute observation window—a snapshot rather than a survey—and simulations that were also somewhat limited. Imperfect images “One thing we just don’t know is how small these Kelvin-Helmholtz patterns get on the Sun,” Kuridze says. What we can resolve is very close to the resolution limit, so it’s possible we’re missing ones below that. One way around this is to let the simulations run finer than the telescope can see. The team tried to do that but with little luck so far. “When you do this at higher resolution in the simulations, some extra physics needs to be involved, and we are not sure exactly how things work in computational simulations when you need to reach those resolutions,” he says. “This is a completely new area, and we need to do more investigation.” Another limitation comes from the kind of data the team got from the DKIST, which mostly provided high-resolution visual images. These worked as a decent proxy for the location and strength of the magnetic fields, but they were still just a proxy. Everything the team knows about how fast the plasma is actually moving comes from the simulations rather than from the telescope, and the magnetic field driving the whole thing has never been measured directly at this scale. The team thinks most lingering uncertainties can be resolved by extending the observations beyond the current three-minute window. “If you want to quantify how the magnetic field is evolving in time, what sort of dissipation you have, how much energy is released, how much energy budget there is for eruptions and flares—you need much longer observations, and you need magnetic maps,” Kuridze says. “This is the next challenge and the next milestone.” Nature, 2026. DOI: 10.1038/s41586-026-10871-3 Jacek Krywko is a freelance science and technology writer who covers space exploration, artificial intelligence research, computer science, and all sorts of engineering wizardry. 3 Comments
The world's biggest solar telescope caught vortexes on the Sun's surface
Full Article
Original Source
Read the full article at Arstechnica →KhanList aggregates and links to publicly available news content. We do not host full articles from third-party sources. Always verify important information with original sources.