
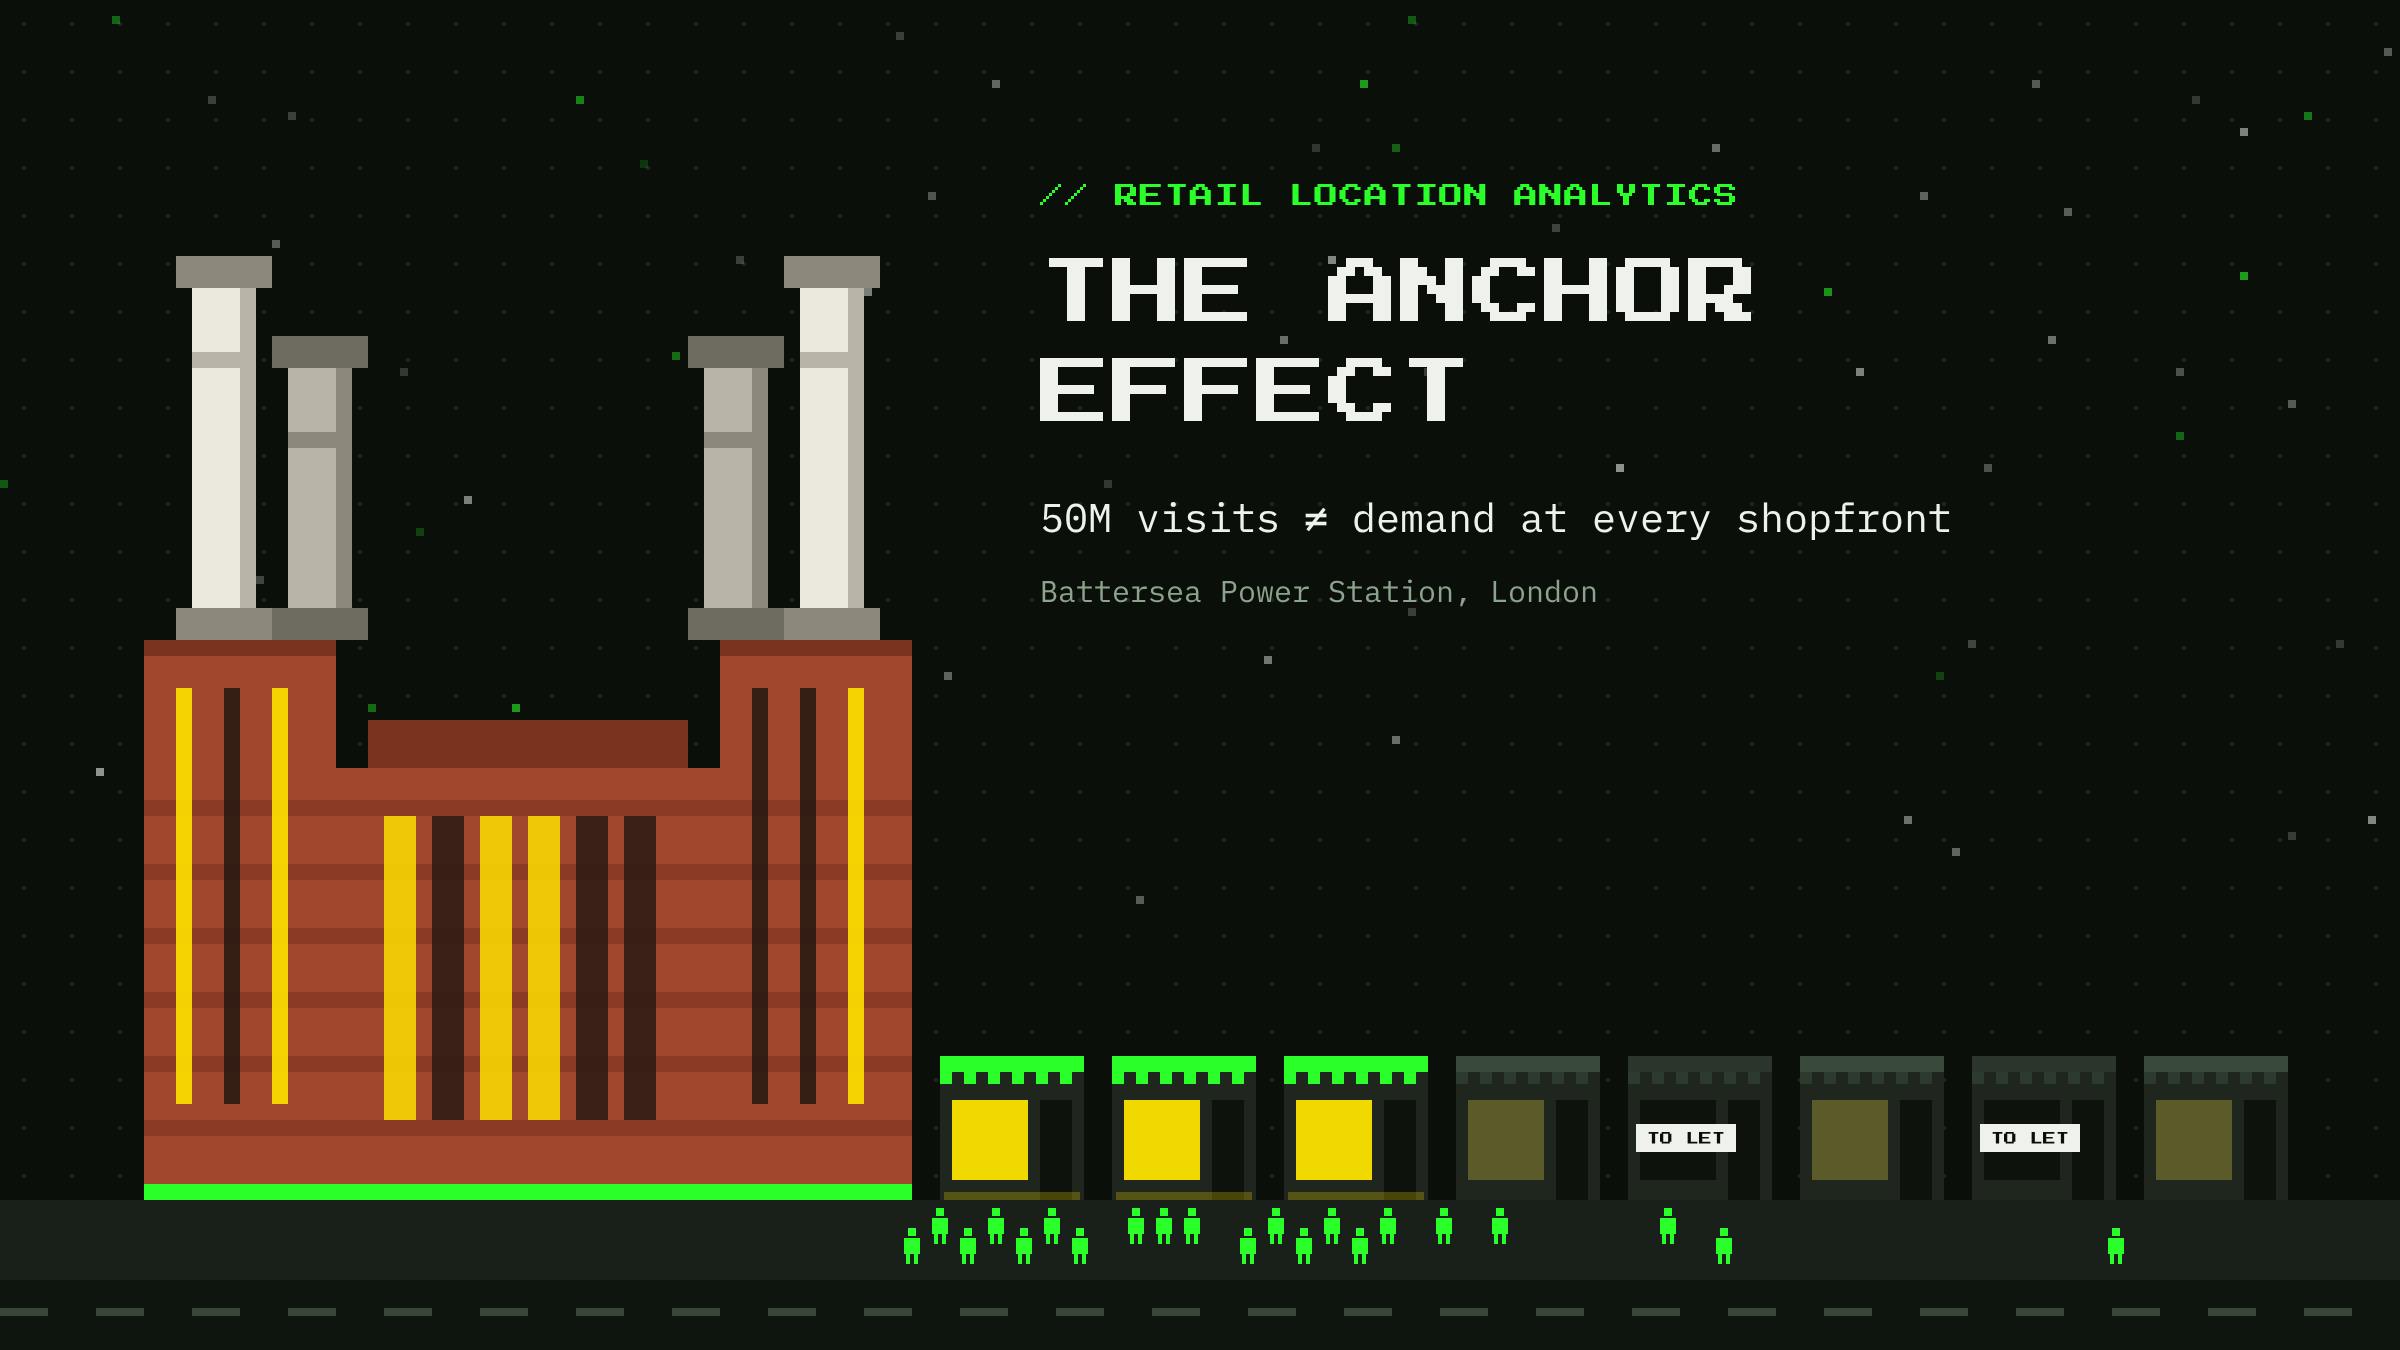
1. The 50-Million-Visitor Metric On 30 September 2026, Battersea Power Station's developers announced its 50-millionth visitor since the restored landmark opened in October 2022. The milestone signals destination appeal, not shopfront footfall. It is neither a count of unique customers nor evidence of how visitors move or what they intend to buy.Here, an anchor is a major district destination, not a conventional shopping-centre tenant. Its benefit depends on visitor routes and spending.2. Spatial Divergence in Master-Planned Estates The Wandsworth Council Town Centre Monitoring Report 2025 records vacancy across four completed Battersea zones. Zone Vacant / Total Vacancy Arches Lane 5 / 13 38% Electric Boulevard 5 / 19 26% Turbine Hall 7 / 100 7% Circus Road West 1 / 16 6% Total 18 / 148 12% Source: Wandsworth Council, Table 41; survey: 3 October–7 November 2025. Vacancy ranges from 6% to 38%. Table 41 covers 148 units in completed zones; the report refers to around 150 across the wider development. It records occupancy, not why units were vacant. The datasets cover different periods (the survey was in autumn 2025; the visitor milestone was announced in September 2026) and establish no link between visits and vacancy. Vacancy may also reflect rents, unit size, lease terms or fit-out.3. From Destination Traffic to Storefront Exposure A destination visitor does not necessarily pass every unit, notice its frontage, enter, or buy. The path to purchase has five stages: [Destination Arrivals] │ ▼ [Pedestrian Routes] │ ▼ [Frontage Exposure] │ ▼ [Store Entrances] │ ▼ [Transactions] This is a conceptual measurement chain, not a funnel measured at Battersea. Destination arrivals: People entering the development. Pedestrian routes: The paths they use. Frontage exposure: Passages within a shopfront's visible approach area. Store entrances: Passers-by crossing the threshold. Transactions: Visitors completing a purchase. The stages are not interchangeable: destination visits are not frontage footfall, and frontage footfall is not sales. A side-street shop may receive less traffic than one on the main boulevard, even near the same station. Test this with network analysis and observed counts.4. Proximity, Accessibility, and Exposure These measures answer different spatial questions: 1. PROXIMITY Euclidean buffer - How close is the unit in a straight line? 2. ACCESSIBILITYNetwork isochrone - How easily can pedestrians reach it? 3. EXPOSUREFrontage flow and visibility - How many people pass the shopfront? Proximity uses a Euclidean buffer, such as a 300-metre circle. It gives a quick overview but ignores railway lines, buildings and inaccessible entrances.Accessibility uses a network isochrone: the area reachable within a given time along pedestrian paths. A five-minute isochrone measures reachability, not movement; quiet and busy streets may lie within the same area.Exposure is pedestrian flow past a frontage and the opportunity to see it. It depends on route choice, entrance position, barriers and sightlines. Network and origin-destination models estimate routes, not actual frontage flow; observed counts or validated mobility data are needed.Two units may both be 150 metres' walk from a station. Unit A is visible from the main route to nearby offices; Unit B is behind a corner. Their isochrones may match, but A could receive more pass-by exposure. Counts establish the difference.5. Matching Pedestrian Flow to the Occupier's P&L Footfall has no universal commercial value: its importance depends on the tenant's business model, opening hours and customer behavior. A simplified revenue model is:Estimated Revenue = Catchment Footfall × Frontage Capture Rate × Store Entry Rate × Purchase Conversion × Average Transaction Value The variables represent catchment volume, frontage capture, entry, purchase conversion and average spend. Use a consistent period; if footfall is counted at the shopfront, omit the first two stages. This estimates sales, not profit.Connecting revenue to occupancy costsOCR = Occupancy Costs/Store Revenue × 100% The Occupancy Cost Ratio compares revenue with rent and defined property charges, such as service charges. Use consistent cost definitions and revenue excluding VAT.High exposure does not guarantee viability. If occupancy costs exceed what achievable revenue can support, the tenant may struggle. OCR is not profitability-gross margin, staffing and other expenses still matter-but it links location quality to the cost of securing it.Different retail formats, different flow profiles Grab-and-go coffee: Commuters may help, but offices, homes, leisure destinations and repeat customers also drive demand. Casual dining: Lunch and evening patterns may matter more than daily totals; offices, residents and leisure uses contribute at different times. Specialist and appointment-led retail: Showrooms may rely on planned visits and referrals rather than walk-ins; accessibility may matter more than passing footfall. An anchor can generate complementary demand or retain spending in its own restaurants, cafés and shops. The effect depends on tenant category, routes and overlap between offers.6. A Diagnostic Framework for Retail Site Selection. Move from broad context to unit-level evidence: Define the unit and catchment: frontage, entrances, nearby destinations and target customers. Map the pedestrian network: streets, crossings, station exits, restrictions and barriers. Assess routes and visibility: likely origins, destinations and sightlines; validate modelled routes. Measure frontage flow: pedestrian counts or privacy-compliant mobility data across times, weekdays, weekends and seasons. Evaluate tenant fit: establish whether nearby uses complement or compete with the proposed business. Test the economics: estimate revenue, calculate OCR and compare it with gross margin, rent, service charges, staffing and fit-out costs. Test downside and upside scenarios. A single footfall score cannot capture the commercial case. Identify the assumptions driving the result and the evidence supporting them.7. What Public Data Can and Cannot Tell Us Public data provides a starting point, not the final answer. Developer metrics show destination activity, not movement between zones, repeat visits, or traffic at a particular unit. Check the counting methodology before treating a milestone as a unique-visitor figure. Municipal reports, such as Wandsworth Council's survey, provide occupancy and commercial-use information, not reasons for vacancy, store sales, conversion rates or lease terms.Transport datasets from TfL Open Data and its API portal help establish accessibility. Station-level passenger data does not measure pedestrian movement along individual streets or shopfronts.Combine planning and occupancy records, transport and pedestrian-network data, privacy-compliant mobility data, frontage counts and tenant assumptions.For an individual Battersea unit, these sources cannot show which routes carry the most pedestrians or count shopfront passers-by. That requires geocoded entrances, route analysis and observed or validated flow data. Accessibility maps are not footfall maps.8. Conclusion: Measure the Demand That Reaches the Door Battersea's visitor milestone and Wandsworth Council's survey describe different aspects of the development: destination activity and vacancy across completed zones. Neither explains an individual unit's performance. Proximity, accessibility and exposure must be kept separate. A unit can be close to an attraction but poorly positioned on pedestrian routes, easy to reach but receive little spontaneous traffic, or busy yet fail to attract customers suited to the tenant's offer.Connect spatial evidence to observed movement and store economics: estimate frontage flow, model sales conversion and test whether revenue supports occupancy costs. That is the difference between measuring destination activity and assessing a retail location.
The Anchor Effect: Why Destination Footfall Doesn't Equal Retail Demand
Full Article
Original Source
Read the full article at Hackernoon →KhanList aggregates and links to publicly available news content. We do not host full articles from third-party sources. Always verify important information with original sources.