
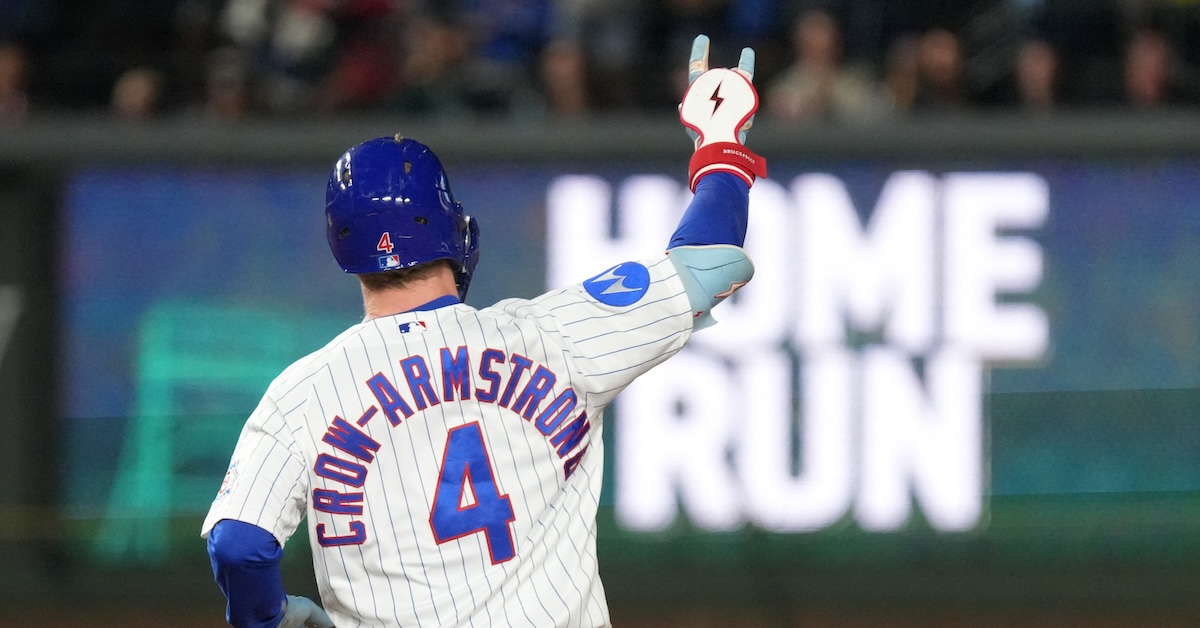
David Banks-Imagn Images One story ends, another begins. The Milwaukee Brewers have hoisted the 2026 World Series trophy and earned an offseason of rest, but for the ZiPS projection system, there is no winter respite. The 2027 season is (hopefully) just around the corner, and as has been the case every year going back to 2005, it’s time to start rolling out projections. For those new to my projections, ZiPS is a computer projection system I initially developed in 2002–04. It was officially released to the public in 2005, after it had reached a level of non-craptitude I was content with. The origins of ZiPS are similar to Tom Tango’s Marcel the Monkey, coming out of discussions I had in the late 1990s with Chris Dial, one of my best friends (our first interaction involved Chris calling me an expletive!) and a fellow stat nerd. ZiPS quickly evolved from its original version as a reasonably simple projection system, and now it both does a lot more and uses a lot more data than I ever envisioned it would 20 years ago. At its core, however, it’s still engaged in two primary tasks: estimating what the baseline expectation for a player is at the moment I hit the button, and then estimating what that player might do in the future using large cohorts of relatively similar players. So why is ZiPS named ZiPS? At the time, Voros McCracken’s theories on how pitching, defense, and balls in play interact were fairly new, and since I wanted to integrate some of his findings, I decided (with his blessing) that the name of my system should rhyme with DIPS (defense-independent pitching statistics). I didn’t like SIPS, so I went with the next letter in my last name. I originally named my work ZiPs as a nod to CHiPs, one of my favorite shows to watch as a kid, but I mis-typed ZiPs as ZiPS when I released the projections publicly, and since my now-colleague Jay Jaffe had already reported on ZiPS for his Futility Infielder blog, I chose to just go with it. I never expected that all of this would be useful to anyone but me; if I had, I would have named it in less bizarre fashion. ZiPS uses multiyear statistics, with more recent seasons weighted more heavily; in the beginning, all the statistics received the same yearly weighting, but eventually, this became more varied based on additional research. And research is a big part of ZiPS. Every year, I run hundreds of studies on various aspects of the system to determine their predictive value and better calibrate the player baselines. The data now included in the system has grown considerably since 2002. Basic hit, velocity, and pitch data started playing a larger role beginning in 2013, while data derived from Statcast has been incorporated in recent years as I’ve gotten a handle on its predictive value and the impact of those numbers on existing models. I believe in cautious, conservative design, so data are only included once I have confidence in their improved accuracy, meaning there are always builds of ZiPS that are still a couple of years away. Additional internal ZiPS tools like zBABIP, zHR, zBB, and zSO are used to better establish baseline expectations for players; these stats work similarly to the various flavors of “x” stats, with the “z” standing for something I’d wager you’ve already guessed. How does ZiPS project future production? First, using both recent playing data with adjustments for zStats, and other factors such as park, league, and quality of competition, ZiPS establishes a baseline estimate for every player being projected. To get an idea of where the player is going, the system compares that baseline to the baselines of all other players in its database, also calculated from the best data available for the player in the context of their time. The current ZiPS database consists of about 158,000 baselines for pitchers and about 191,000 for hitters. For hitters, outside of knowing the position played, this is offense only; how good a player is defensively doesn’t yield information on how a player will age at the plate. Using a whole lot of stats, plus information on the shape of a player’s production and other characteristics, ZiPS then finds a large cohort that is most similar to the player. I use Mahalanobis distance extensively for this. A few years ago, Brandon G. Nguyen did a wonderful job broadly demonstrating my process while he was a computer science/math student at Texas A&M, though the variables used aren’t identical. It should serve as a reminder that ZiPS is the product of a lot of work and time, rather than a particularly high level of inspiration. The main advantages of Mahalanobis distance are that it’s not stymied by different scales of variables and it adequately deals with the correlation between the different numbers. As an example, here are the current top 50 near-age comparables for possible National League MVP Pete Crow-Armstrong, a particularly difficult player to comp. The total cohort is much larger than this, but 50 ought to be enough to give you an idea:You Aren't a FanGraphs MemberIt looks like you aren't yet a FanGraphs Member (or aren't logged in). We aren't mad, just disappointed. We get it. You want to read this article. But before we let you get back to it, we'd like to point out a few of the good reasons why you should become a Member. 1. Ad Free viewing! We won't bug you with this ad, or any other. 2. Unlimited articles! Non-Members only get to read 10 free articles a month. Members never get cut off. 3. Dark mode and Classic mode! 4. Custom player page dashboards! Choose the player cards you want, in the order you want them. 5. One-click data exports! Export our projections and leaderboards for your personal projects. 6. Remove the photos on the home page! (Honestly, this doesn't sound so great to us, but some people wanted it, and we like to give our Members what they want.) 7. Even more Steamer projections! We have handedness, percentile, and context neutral projections available for Members only. 8. Get FanGraphs Walk-Off, a customized year end review! Find out exactly how you used FanGraphs this year, and how that compares to other Members. Don't be a victim of FOMO. 9. A weekly mailbag column, exclusively for Members. 10. Help support FanGraphs and our entire staff! Our Members provide us with critical resources to improve the site and deliver new features! We hope you'll consider a Membership today, for yourself or as a gift! And we realize this has been an awfully long sales pitch, so we've also removed all the other ads in this article. We didn't want to overdo it. In case you didn't read all that, here's the short version. Membership includes:✓Ad-free browsing✓Unlimited FanGraphs & RotoGraphs articles✓Historical & platoon projections✓Leaderboard & player-page stat heatmaps✓One-click data exports✓Customizable player-page dashboards✓Dark & Classic site modes✓Weekly Members-only mailbag✓FanGraphs Walk-Off, your year in review✓Optional homepage photo removal✓Gift articles to non-Members✓Full postseason coverage Top 50 Offensive Comps for Pete Crow-Armstrong With candidates in the hundreds of thousands, not the billions, you’re never blessed with perfect comps. From testing, I know that ZiPS works significantly better over the long haul when players like Crow-Armstrong are compared to similar players rather than the Luis Arraezs or Tyler Stephensons or Chandler Simpsons of the world. The exact mix the algorithm uses to assemble comps was determined by extensive testing, basically by having a computer running ZiPS 24/7 for about a year. The large group of similar players is then used to calculate an ensemble model on the fly for a player’s future career prospects, both good and bad. One of the tenets of projections I follow is that no matter what the ZiPS projection says, that’s what the projection is. Even if inserting my opinion would improve a specific projection, I’m philosophically opposed to doing so. ZiPS is most useful when people know that it’s purely data-based, not some unknown mix of data and my opinion. Over the years, I like to think I’ve taken a clever approach to turning more things into data — for example, the system’s use of basic injury information — but some stuff just isn’t in the model. ZiPS doesn’t know if a pitcher wasn’t allowed to throw his slider coming back from injury, or if a left fielder suffered a family tragedy in July. Those sorts of things are outside a projection system’s purview, even though they obviously can affect on-field performance. ZiPS isn’t mathemagical, and anyone using a useful tool should know its limitations and apply their own judgment to the question at hand. It’s also important to remember that the bottom-line projection is, in layman’s terms, only a midpoint. You shouldn’t expect every player to hit that midpoint; 10% of players are “supposed” to fail to meet their 10th-percentile projection, just like 10% of players are “supposed” to pass their 90th-percentile forecast. This point can create a surprising amount of confusion. ZiPS gave a .300 batting average projection to just one player in 2026: Luis Arraez. But that’s not the same thing as ZiPS thinking there would only be a single .300 hitter. On average, ZiPS thought there would be nine qualified hitters who would eclipse .300, not one. In the end, there were seven. Another crucial thing to bear in mind is that the basic ZiPS projections are not playing-time predictions; by design, ZiPS has no idea who will actually play in the majors in 2027. The system only makes projections for how players would perform in full-time major league roles. Having ZiPS tell me how someone would hit as a full-time player in the big leagues is a far more interesting use of a projection system than if it were to tell me how that same player would perform as a part-time player or a minor leaguer. That’s why for the depth charts that go live in every team projection article, I use the FanGraphs Depth Charts to determine the playing time for individual players. I haven’t made any major updates to the system this year, though I’m inching closer to a ZiPS-specific stuff model, which probably needs a year or two more of live data. I did, however, make the usual calibration adjustments and quality-of-life updates that make ZiPS simpler to run, while providing more ways to look at projection data. Have any questions, suggestions, or concerns about ZiPS? I’ll try to reply to as many of your inquiries as I reasonably can in the comments below. Also, if the projections have been valuable to you now or in the past, I would urge you to consider becoming a FanGraphs Member, should you be in a position to do so. It’s with your continued and much appreciated support that I have been able to keep so much of this work available to the public for so many years. Improving and maintaining ZiPS is a time-intensive endeavor, and reader support allows me the flexibility to put an obscene number of hours into the system’s development. It’s hard to believe I’ve been working on ZiPS for nearly half my life now! Hopefully, the projections and the things they’re helped us learn about baseball have provided you with a return on your investment, or at least a small measure of entertainment, whether it’s from being delighted or enraged. I’ll start rolling out the team breakdowns tomorrow, beginning with the Brewers.
The 2027 ZiPS Projections Are Almost Here
Full Article
Original Source
Read the full article at Blogs →KhanList aggregates and links to publicly available news content. We do not host full articles from third-party sources. Always verify important information with original sources.