
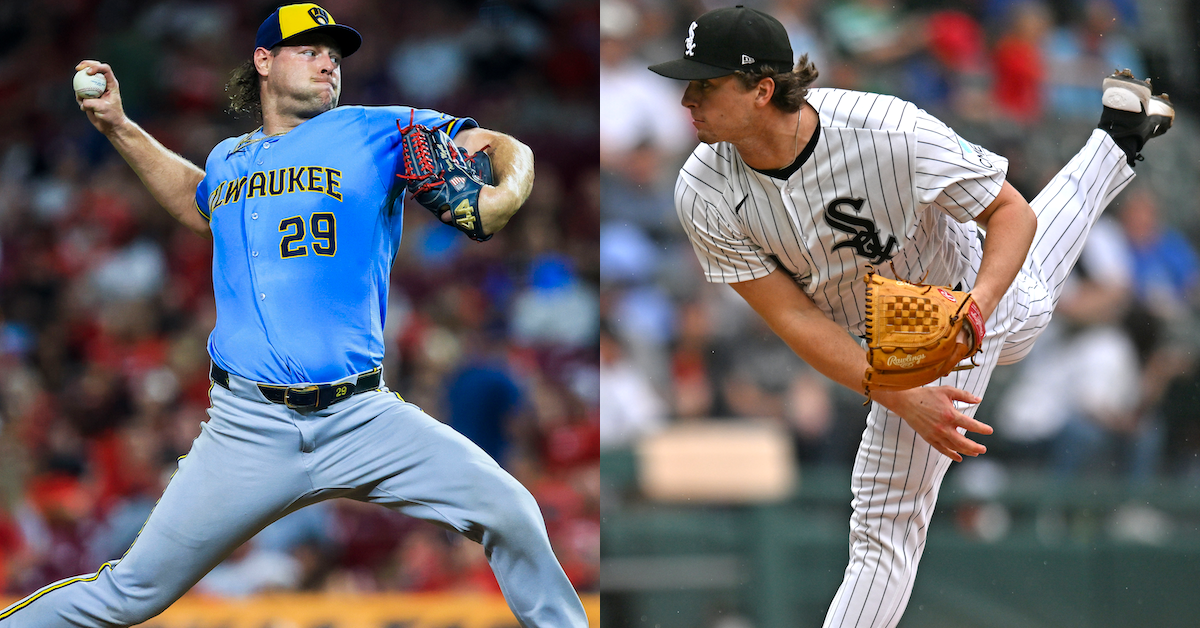
Katie Stratman and Patrick Gorski-Imagn Images Welcome to day three of our pitching superlatives series. In part one we talked about velocity, and in part 2 we talked about movement. Today we’re talking about location, and I have to tell you, location is a weird topic in today’s game. First, the strike zone shrank. The strike zone has actually been shrinking for a while now, but due to the implementation of the ABS challenge system, it also shrank more quickly just this year. Second, over the past several years, pitchers have gotten so good that teams spend a lot of time trying to convince them to just trust their stuff and rip it right down the middle. You might recall that the Angels went so far as to have their pitchers stand in as batters against the Traject Ark’s version of their own stuff, just to remind them of how nasty they were. In some ways, you could argue that command has never mattered less than it does right now. That doesn’t mean that location doesn’t matter at all. I’m sure you’ve seen it before, but here’s the diagram that shows Statcast’s Attack Zones. In 2026, if you threw a pitch right down the middle (in Zone 5, you were 69% more likely to give up a home run than if you threw it elsewhere in the strike zone. That’s why 23% of home runs were hit on middle-middle pitches even though just 7% of pitches were middle-middle. Location may matter less, but people will still tell you that home runs are thrown, not hit, and they’re right. As is always the case when it comes to pitching, context matters a lot. Here’s something I wrote when I looked into the “Throw It Down the Middle” philosophy back in 2024. (In this context, when I talk about the heart of the plate, I’m using Statcast’s definition, Attack Zones 1 through 9). I was surprised to find that the correlation between stuff and performance is a bit weaker over the heart of the plate. For example, on pitches over the heart of the plate, Stuff+ and hard-hit rate have a correlation coefficient of -.32. Outside the heart of the plate, that correlation coefficient is -.42. Wherever you throw the ball, having better stuff will result in fewer hard-hit balls, but that stuff is less of a differentiator right over the middle of the plate. I guess I was surprised because I figured anybody can induce a weakly hit ball if they’ve got you chasing or swinging at a pitch right on the corner, but it takes better stuff to make you look bad on a pitch right down the middle. It turns out this is wrong; better stuff plays up everywhere, but even more so outside the heart of the plate. Once you’re throwing a meatball, the quality is less important. I think this illuminates the complexity of the issue, because to some extent, there’s a lie at the heart of the “Throw It Down the Middle” School of Pitching. Knowing all that, which pitch gets thrown right down the middle the most often? As we’ve been doing throughout this series, we’re looking only at pitches that were thrown at least 152 times during the 2026 season, which gives us a sample of 1,540 offerings. The superlative for Meatballiest Pitch goes to Brandon Pfaadt’s sinker, which ended up in Zone 5 exactly 14.9% of the time. It’s worth noting that last year, that would have only put Pfaadt in sixth place. I suspect the change has to do with the shrinking of the strike zone due to the implementation of the ABS challenge system. After all, if the zone shrinks, so do all its constituent parts.You Aren't a FanGraphs MemberIt looks like you aren't yet a FanGraphs Member (or aren't logged in). We aren't mad, just disappointed. We get it. You want to read this article. But before we let you get back to it, we'd like to point out a few of the good reasons why you should become a Member. 1. Ad Free viewing! We won't bug you with this ad, or any other. 2. Unlimited articles! Non-Members only get to read 10 free articles a month. Members never get cut off. 3. Dark mode and Classic mode! 4. Custom player page dashboards! Choose the player cards you want, in the order you want them. 5. One-click data exports! Export our projections and leaderboards for your personal projects. 6. Remove the photos on the home page! (Honestly, this doesn't sound so great to us, but some people wanted it, and we like to give our Members what they want.) 7. Even more Steamer projections! We have handedness, percentile, and context neutral projections available for Members only. 8. Get FanGraphs Walk-Off, a customized year end review! Find out exactly how you used FanGraphs this year, and how that compares to other Members. Don't be a victim of FOMO. 9. A weekly mailbag column, exclusively for Members. 10. Help support FanGraphs and our entire staff! Our Members provide us with critical resources to improve the site and deliver new features! We hope you'll consider a Membership today, for yourself or as a gift! And we realize this has been an awfully long sales pitch, so we've also removed all the other ads in this article. We didn't want to overdo it. In case you didn't read all that, here's the short version. Membership includes:✓Ad-free browsing✓Unlimited FanGraphs & RotoGraphs articles✓Historical & platoon projections✓Leaderboard & player-page stat heatmaps✓One-click data exports✓Customizable player-page dashboards✓Dark & Classic site modes✓Weekly Members-only mailbag✓FanGraphs Walk-Off, your year in review✓Optional homepage photo removal✓Gift articles to non-Members✓Full postseason coverage While we’re talking about meatballs, we also need to recognize Brewers closer Trevor Megill. He threw his four-seamer right down the middle 12.4% of the time, which put it in 19th place. However, Megill threw his four-seamer 65% of the time, which gave it one of the highest usage rates of any pitch. As a result, nobody threw more pitches down the middle than Megill, the Meatballsiest Pitcher in baseball. Here’s the fun thing: Megill’s four-seamer is a fantastic pitch, even when he throws it down the middle. That’s why he throws it all the time. By Statcast’s run values, his Zone 5 four-seamers were worth five runs, tied for ninth among all pitches. By contrast, Pfaadt’s sinker is a middling pitch at best, and when he threw it right over the middle, it got hammered to the tune of a .514 wOBA. Pfaadt’s meatball sinkers were worth -4 runs, which put him in the bottom 30. Pfaadt gave up seven meatball homers, but amazingly, the majority of them came on his four-seamer rather than his sinker. Should we, in the name of science, watch all seven of them? I think that’s the only responsible choice. While we’re in Zone 5, we should also look at the other end of the leaderboard, because it’s wild. Brent Headrick threw 162 splitters in 2026. Just one of them went over the heart of the plate. That 0.6% meatball rate made Headrick’s splitter the Veganest Pitch in baseball. In fact, 15 of the bottom 16 pitches are offspeed offerings. It seems that if your goal is just to bury the pitch below the zone and hope for a swing, you’ve got a pretty achievable goal. Here’s the only splitter that Headrick threw in Zone 5 all season. It worked out just fine. Maybe he should try it more often. The really fun thing is that if you look closely, you’ll notice that a bird swooped in front of the camera right before he threw the pitch, as if Headrick hitting Zone 5 with a splitter was such an abnormal occurrence that it required a dark omen. Headrick’s changeup also won the Most Heartless Pitch superlative, as he threw it in the heart zone just 4.9% of the time. The guy just did not want batters to swing at the pitch. On the flip side, Cooper Criswell’s sinker won the Heartiest Pitch, as it hit the heart zone 41% of the time. As you’d expect, 49 of the top 50 pitches on this leaderboard were fastballs of one kind or another. So let’s show some respect to Ryan Gusto, whose slider somehow had the 16th-highest heart rate of any pitch. It’s worth pointing out that Gusto’s slider is a gyro slider that doesn’t break much at all, presumably making it easier to locate. Still, the guy just loves throwing it in the zone. With that, let’s move out to the shadow zone. As I assume you’ll never grow tired of reading, the shadow zone is the area that’s within one baseball’s width of the edge of the strike zone. I first looked at individual pitches, and I was delighted to find one clear winner for the Shadiest Pitch superlative. In 2026, Baltimore’s Albert Suárez threw his changeup in the shadow zone 58% of the time. That was nearly five percentage points more than the player in second place – a huge margin – and it would have been good enough to win in five of the last six seasons. A 58% mark is enormous. Not only does Suárez’s changeup hit the shadow zone a lot, the pitch chart shows you that he’s got a very, very clear plan for it. I mean, that’s a thing of beauty. Suárez only throws the changeup to lefties, and he always tries to hit the outside corner at the bottom of the zone. The pitches below Suárez’s on the list are fastballs, and they more or less hit all four edges of the zone equally. In other words, they just belong to pitchers who just try to be around the zone a lot. But Suárez is really sticking to his game plan. Here’s a pitch chart that shows all of his changeups, not just the ones that hit the shadow zone. Clearly, Suárez’s plan for the changeup is to earn swings or called strikes on his pitch or settle for throwing a ball. He never gives in and throws a hittable changeup. He threw just five of them that could be reasonably labeled down the middle, and he almost never missed up or to his glove side. We’re now entering the chase and waste zones, and we’re gong to mix things up. I’m less concerned about who throws pitches in those areas the most. Lots of pitches are designed to be chased, and therefore get thrown outside the zone a whole lot. The top five pitches in chase-zone rate are separated by less than a percentage point of usage. And according to Statcast’s run values, 19 of the top 20 put up negative value. Instead, I’d like to highlight the Chasiest Pitch, which belongs to Aaron Nola. You might recall that, for the second year in a row, Nola had a train wreck of a season, but it wasn’t his curveball’s fault. Nola pounded the bottom of the zone and below with his knuckle curve, and, as it’s been for most of his career, it was by far his best pitch. When he threw the curve in the waste zone, it was worth eight runs, the best mark in baseball. It ran a 51% swing rate, which ranked sixth (minimum 100 chase-zone pitches). Batters whiffed 56% of the time, and they didn’t exactly succeed when they made contact. They ran just a .041 batting average against it. Nola already leads with the curveball. He threw it 33% of the time in 2026. But maybe he could get up to a nice round 50%. Here was the lowest swinging strike Nola’s knuckle curve got all year. Can you say S for strikeout? Sonny Gray also deserves a shoutout here. At 59%, his formidable sweeper ran the highest chase rate in the chase zone, and although it was worth seven runs, just behind Nola’s knuckle curve, it was even better on a per-pitch basis. That brings us to the waste zone, and again, there’s not much value in talking about the players who threw the ball there most often, because nobody wants to throw the ball in the waste zone. Instead, we should congratulate Grant Taylor, whose curveball wins the Least Wasteful Waste Pitch. Somehow, Taylor’s curve ran a 31% swing rate in the waste zone, second only to Mason Miller’s slider, and of the 1,540 pitches we analyzed, it was the only one to be worth at least one run in the waste zone. Way to go Grant Taylor. Here’s the only time someone made contact with Taylor’s curveball in the waste zone. Are you ready for this? I promise you you’re not. Yeah, Ozzie Albies fouled this pitch off after it bounced. He tried to check his swing and failed, but luckily, the ball bounced off the ground and straight into his bat. That’s what it takes to hit Taylor’s curveball when it’s in the waste zone. So that covers all of the attack zones, but we should still highlight a couple more fun locations. Scroll up to the top and look at the Attack Zones map again, because we’re next going to look at the pitch that hit zones 11, 13, 17, and 19 most frequently. Those are the four corners of the strike zone, but only in the shadow zone. In other words, we’re looking for the pitch that never hit anything but the true corner of the strike zone. The Cornerniest Pitch superlative goes to Merrill Kelly’s slider, which hit a corner 20% of the time, nearly three percentage points more than any other pitch. The pitch chart is hilarious. Kelly only threw his slider to righties, and he only ever aimed low and away. He was fantastic at hitting the corner, which is why all those dots effectively form a perfect square in zone 19. And then, just one single hilarious time, Kelly also backed up a slider that just barely caught zone 11. Now we’re going to look at the four pitches that were most extreme in one particular direction. Landen Roupp’s four-seamer crossed the plate at an average height of 3.55 feet, making it the Highest Pitch in baseball, while Brendon Little’s knuckle curve was the Lowest Pitch at 0.98 feet. José Alvarado’s cutter was the furthest toward the third-base side, so we’ll call it the Leftiest Pitch, averaging 1.06 feet from the center of the plate. Jacob Lopez’s changeup was the Rightiest Pitch at 0.90 feet from the center in the other direction. You may be surprised to see some overlap in the pitch charts of both groups. In order to be so extreme in one direction, you need to be focused on one quadrant of the zone, yes, but you also just need to miss kind of a lot in every direction. These are some expansive heat maps. We’re going to close out with the one location that you might have been waiting for this whole time. Which pitch just plain hit the zone most often? It belonged to journeyman reliever Tyron Guerrero, who put up a fantastic season for the Red Sox in his first year back from Japan. Guerrero is 6-foot-8 with huge extension, and he throws a sinker that averages 100.2 mph. Guerrero threw a four-seamer 80% of the time back in his first stint in the majors, but his game plan now is simple: Dare batters to do something with the sinker. He threw it 86% of the time, and he hit the zone 52.4% of the time. That wasn’t just the highest zone rate in baseball, it was more than six percentage points above the second-place pitch. It would’ve been the top zone rate in four of the last five years (and here I need to remind you that the strike zone shrank this year). And even when Guerrero’s sinker didn’t hit the zone, it was mighty close. If you throw in pitches that missed the zone but still hit the shadow zone, he jumps up to 68.2%, once again a commanding lead. Guerero’s sinker was not just the Zoniest Pitch but the Zone-Adjacentest Pitch in baseball. Guerrero didn’t miss that many bats, but because everybody expected him to hit the zone constantly, when he did throw it outside the zone, he ran a fantastic chase rate. So he struck out an above average amount of batters, he walked nobody, and he elicited tons of weak contact because he could just bully people in the zone with the sinker. If I could do this, I’d probably just throw the ball over the plate too. Now that we’ve tackled velocity, movement, and location, tune in tomorrow, when we’ll be highlighting the pitches that get superlative results.
The 2026 Pitching Superlatives, Part 3: Location
Full Article
Original Source
Read the full article at Blogs →KhanList aggregates and links to publicly available news content. We do not host full articles from third-party sources. Always verify important information with original sources.