
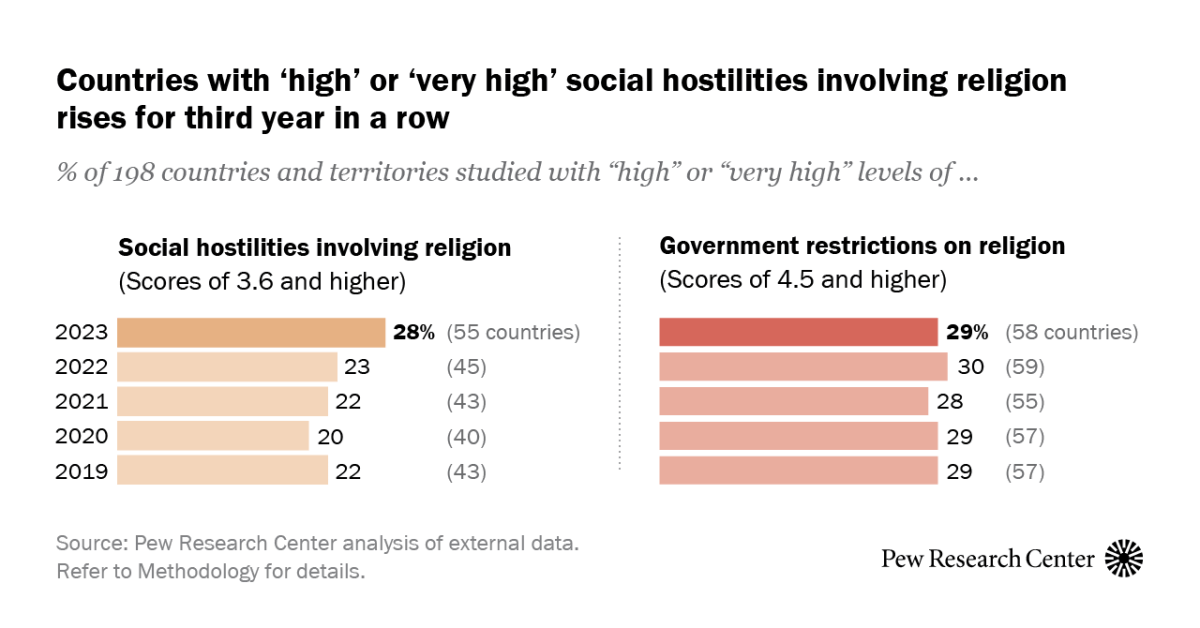
About this research This is Pew Research Center’s 16th annual report on levels of restrictions on religion around the world. It scores 198 countries and territories on two separate indexes: The Government Restrictions Index (GRI) measures actions by government officials at all levels that restrict religious beliefs and practices. Government restrictions include laws, policies and pronouncements that ban or limit religious beliefs or practices. A few examples are: barring a religious group from holding worship services; outlawing certain types of religious attire; and favoring or punishing religious groups through public funding. The Social Hostilities Index (SHI) measures acts of religious hostility by private individuals, groups or organizations. Social hostilities include harassment (whether physical or nonphysical), mob violence, militant activity, terrorism and disparaging statements that are motivated by religion or target religious groups. A few examples are: vandalism of religious sites; harassment of individuals because of their religious clothing; and physical attacks on people involved in religious conversions or proselytizing. To create these indexes, researchers annually comb through publicly available, widely cited sources of information, including publications by the U.S. State Department, the U.S. Commission on International Religious Freedom, the United Nations, and several independent, nongovernmental organizations such as the International Crisis Group, Freedom House, Amnesty International and Human Rights Watch. To learn more about how Pew Research Center tracks restrictions on religion, read the Methodology. This analysis was produced by Pew Research Center as part of the Pew-Templeton Global Religious Futures project, which analyzes religious change and its impact on societies around the world. Funding for the Global Religious Futures project comes from The Pew Charitable Trusts and the John Templeton Foundation (grant 63095). This publication does not necessarily reflect the views of the John Templeton Foundation. In 2023, sub-Saharan Africa was the only major region in the world where median levels of both government restrictions on religion and social hostilities involving religion decreased. What is a median? In this analysis, medians are used to help readers see overall patterns in the data. A median is the middle number in a list of figures sorted in ascending or descending order. In this report, within each geographic region (and for all 198 countries and territories we study overall), our researchers list the relevant countries from lowest to highest based on index scores. The median score is the score of the middle country on the list. For a region like sub-Saharan Africa, which has an even number of countries (48), we take the average of the two middle countries on the list. For sub-Saharan Africa, those are the countries whose index scores rank 24th and 25th in the region. In three other large regions – Europe, Asia and the Pacific, and the Middle East and North Africa – median levels of government restrictions and social hostilities rose in 2023. In the Americas, the other major region covered by the study, the median score for government restrictions held steady while social hostilities ticked slightly upward. Worldwide, the median scores of all 198 countries and territories across the five regions remained stable for the third year in a row at 3.0 out of 10 on the Government Restrictions Index (GRI) and 1.6 out of 10 on the Social Hostilities Index (SHI). The GRI consists of 20 indicators of how government officials, laws and policies restrict religion. The SHI consists of 13 indicators of religious hostilities by private individuals, groups and organizations, including terrorist groups. The rest of this section describes how each of the study’s large regions fared on both indexes. It is part of a wider Pew Research Center study of restrictions on religion around the world in 2023. Read the report overview for a broader understanding of the study’s key findings. Government restrictions on religion, by region In 2023, the median GRI scores in Europe, the Asia-Pacific region and the Middle East-North Africa region were as high as, or higher than, they have been since the study began in 2007. In 2023, median levels of government restrictions on religion went up in Asia-Pacific, Europe, Middle East-North Africa Median scores on the Government Restrictions Index (GRI) Source: Pew Research Center analysis of external data. Refer to the Methodology for details.“More Countries Had Elevated Levels of Social Hostilities Involving Religion in 2023” PEW RESEARCH CENTER In 2023, median levels of government restrictions on religion went up in Asia-Pacific, Europe, Middle East-North Africa Median scores on the Government Restrictions Index (GRI) YearAmericasAsia-PacificEuropeMiddle East-North AfricaSub-Saharan AfricaWorld20071.03.21.74.71.61.820080.93.72.05.31.11.920091.13.41.85.21.41.820101.23.42.35.91.92.620111.54.22.25.91.92.320121.53.52.66.21.72.420131.54.22.56.01.82.420141.63.72.65.41.52.520151.74.02.75.92.22.720162.24.02.76.12.52.820172.03.82.96.02.62.820182.04.42.86.22.72.920192.04.12.96.02.62.920202.04.22.95.92.62.820212.14.23.15.92.63.020221.84.62.96.13.03.020231.84.73.26.22.73.0 Source: Pew Research Center analysis of external data. Refer to the Methodology for details.“More Countries Had Elevated Levels of Social Hostilities Involving Religion in 2023” PEW RESEARCH CENTER In the Middle East and North Africa, the median GRI score rose from 6.1 in 2022 to 6.2 in 2023, tying with the region’s previous peak scores in 2012 and 2018. As in all previous years of the study, the Middle East and North Africa had the highest median GRI score of any region in the world. Several factors contributed to the region’s high scores. All 20 countries in the Middle East and North Africa had at least one case of government harassment of religious groups (verbal and/or physical) reported in 2023 by the sources used in this study. For more details, refer to the Methodology and the report’s discussion of government harassment. Half of the countries in the Middle East-North Africa region also had restrictions related to religious dress, an increase from eight countries with such cases in 2022 to 10 in 2023. In Jordan, for example, Jewish travelers reported facing hurdles at border crossings when they dressed in ways that revealed their religion. In April, one traveler said he was not allowed to cross the border because he did not agree to hide or cut his side curls (facial hair typically worn by ultra-Orthodox Jewish men). Jordanian authorities reportedly told other travelers it was not safe to “display characteristics that identified them as Jewish” such as a kippah, a traditional skullcap for men, according to the State Department. Meanwhile, Morocco formally has maintained a ban on the import, production and sale of burqas – Islamic face coverings for women – since 2017. The government deemed the ban necessary for security reasons so officials could identify wearers. Additionally, burqas were forbidden for police officers, women in the Moroccan army and television news presenters, though private individuals were still able to wear them, according to the U.S. State Department’s annual report on international religious freedom. The Asia-Pacific region’s median GRI score rose from 4.6 in 2022 to 4.7 in 2023, the highest it has been since the study began in 2007. This region contains 50 countries and territories, including places with some of the highest GRI scores in the world, such as China, Iran, Afghanistan and Indonesia. In 2023, nine countries in Asia and the Pacific sought to eliminate the presence of a religious group, according to the sources used in this study. In Vietnam, authorities tried to force followers of Duong Van Minh (who are mainly from the ethnic Hmong community) to renounce their faith through repeated intimidation and physical harassment. Authorities broke into followers’ homes and destroyed their altars after the 2021 death and funeral of Duong Van Minh. In 2023, Vietnam’s government claimed to have eliminated “the Duong Van Minh evil-way religion’s influence” in several provinces. Meanwhile, the military in nearby Myanmar (also called Burma) continued to target Rohingya Muslims in what several international organizations and foreign governments, including the U.S. State Department, previously described as a campaign of genocide and crimes against humanity. In addition, the Asia-Pacific region had an uptick in the number of countries and territories (from 44 in 2022 to 46 in 2023) where government harassment of religious groups was reported. There also was a small rise in the number of Asia-Pacific countries whose governments used violence against religious minorities (from 26 to 28). Europe’s median score on the GRI rose from 2.9 in 2022 to 3.2 in 2023, its highest median GRI score since the study began in 2007. The increase resulted in part from growth in the number of European countries whose governments reportedly failed to protect religious groups or provide redress for religious discrimination (up from 16 countries in 2022 to 24 in 2023). For example, in Norway, Jewish community leaders expressed frustration that police did not respond adequately to cases of harassment and were reluctant to bring charges under antisemitism or hate crime statues, which can increase sentences. And in Germany, where Jehovah’s Witnesses experienced hostility over their proselytizing activities, authorities allegedly did not take hate crimes against the group seriously. Jehovah’s Witnesses said police did not show interest in investigating complaints they filed. More than half of the countries in the region (25 out of 45) also had incidents of physical harassment by governments toward religious groups. This was up from 22 countries in 2022. (Refer to the report’s discussion of harassment of religious groups for more examples.) On the other hand, sub-Saharan Africa’s median GRI score declined from 3.0 in 2022 to 2.7 in 2023. Fewer countries across the region had cases of physical harassment by governments against religious groups (26, down from 30 countries in 2022). And in the Americas, the median GRI score remained the same between 2022 and 2023, at 1.8 out of 10. This was the lowest median score of all five regions studied. Government restrictions on religion around the world in 2023 Levels of government restrictions on religion in each country and territory studied, as of 2023 Note: Based on the Government Restrictions Index’s 10-point scale; scores of 0.0 to 2.3 are considered “low,” 2.4 to 4.4 are considered “moderate,” 4.5 to 6.5 are considered “high,” and 6.6 to 10.0 are considered “very high.” For details on how disputed territories are coded, read the Methodology. Source: Pew Research Center analysis of external data. Refer to the Methodology for details.“More Countries Had Elevated Levels of Social Hostilities Involving Religion in 2023” PEW RESEARCH CENTER Government restrictions on religion around the world in 2023 Levels of government restrictions on religion in each country and territory studied, as of 2023 RegionCountryGRI Category2023 GRI ScoreAmericasAntigua and BarbudaLow0.5AmericasArgentinaModerate2.8AmericasBahamasModerate2.9AmericasBarbadosLow1.7AmericasBelizeLow1.4AmericasBoliviaLow0.8AmericasBrazilLow2.3AmericasCanadaLow2.1AmericasChileLow1.6AmericasColombiaLow1.4AmericasCosta RicaModerate2.6AmericasCubaHigh4.5AmericasDominicaLow1.3AmericasDominican RepublicLow1.5AmericasEcuadorLow1.8AmericasEl SalvadorLow1.8AmericasGrenadaLow1.8AmericasGuatemalaModerate2.7AmericasGuyanaLow1.9AmericasHaitiModerate2.7AmericasHondurasLow1.2AmericasJamaicaModerate2.5AmericasMexicoModerate4.4AmericasNicaraguaModerate4.2AmericasPanamaLow1.6AmericasParaguayLow1.9AmericasPeruLow1.9AmericasSt. Kitts and NevisLow1.1AmericasSt. LuciaLow1.7AmericasSt. Vincent and the GrenadinesLow1.2AmericasSurinameLow1.3AmericasTrinidad and TobagoLow1.6AmericasUnited StatesLow2.1AmericasUruguayLow1.6AmericasVenezuelaModerate2.7Asia-PacificAfghanistanVery high8.7Asia-PacificArmeniaHigh4.6Asia-PacificAustraliaLow2.3Asia-PacificAzerbaijanVery high7.3Asia-PacificBangladeshHigh5.5Asia-PacificBhutanHigh4.7Asia-PacificBruneiVery high6.6Asia-PacificCambodiaHigh5Asia-PacificChinaVery high9.1Asia-PacificCyprusModerate2.8Asia-PacificEast TimorLow1.1Asia-PacificFijiModerate2.6Asia-PacificHong KongModerate3.6Asia-PacificIndiaHigh6.4Asia-PacificIndonesiaVery high7.9Asia-PacificIranVery high8.7Asia-PacificJapanLow1.3Asia-PacificKazakhstanHigh6.5Asia-PacificKiribatiLow1.4Asia-PacificKyrgyzstanHigh5.9Asia-PacificLaosVery high6.7Asia-PacificMacaoLow1.2Asia-PacificMalaysiaVery high7.7Asia-PacificMaldivesVery high7.6Asia-PacificMarshall IslandsLow0.4Asia-PacificMicronesia, Federated StatesLow0.4Asia-PacificMongoliaModerate3.1Asia-PacificMyanmarVery high7.3Asia-PacificNauruLow1.8Asia-PacificNepalHigh5.4Asia-PacificNew ZealandLow0.9Asia-PacificPakistanVery high7.1Asia-PacificPalauLow0.5Asia-PacificPapua New GuineaLow1.4Asia-PacificPhilippinesLow2Asia-PacificSamoaLow1Asia-PacificSingaporeVery high6.7Asia-PacificSolomon IslandsLow0.9Asia-PacificSouth KoreaModerate2.5Asia-PacificSri LankaHigh5.9Asia-PacificTaiwanLow1Asia-PacificTajikistanHigh6.4Asia-PacificThailandHigh4.6Asia-PacificTongaLow1.8Asia-PacificTurkeyHigh6.3Asia-PacificTurkmenistanHigh6.5Asia-PacificTuvaluModerate2.6Asia-PacificUzbekistanVery high7.8Asia-PacificVanuatuLow1.6Asia-PacificVietnamVery high7.3EuropeAlbaniaLow1.8EuropeAndorraModerate2.6EuropeAustriaModerate3.8EuropeBelarusVery high6.6EuropeBelgiumModerate2.8EuropeBosnia and HerzegovinaModerate3.3EuropeBulgariaHigh5.5EuropeCroatiaLow2EuropeCzech RepublicLow2.2EuropeDenmarkModerate4.2EuropeEstoniaLow1EuropeFinlandModerate3.5EuropeFranceHigh5.5EuropeGeorgiaModerate4.1EuropeGermanyModerate4EuropeGreeceHigh4.7EuropeHungaryLow2.2EuropeIcelandModerate3.6EuropeIrelandLow1.1EuropeItalyModerate2.9EuropeKosovoModerate3.4EuropeLatviaModerate2.9EuropeLiechtensteinLow2EuropeLithuaniaModerate3EuropeLuxembourgModerate2.4EuropeMaltaLow1.9EuropeMoldovaHigh5.4EuropeMonacoLow1.4EuropeMontenegroModerate2.7EuropeNetherlandsModerate3EuropeNorth MacedoniaModerate3.5EuropeNorwayModerate3.7EuropePolandModerate3.2EuropePortugalLow0.6EuropeRomaniaHigh4.8EuropeRussiaVery high7.7EuropeSan MarinoLow0.6EuropeSerbiaModerate3EuropeSlovakiaModerate3.8EuropeSloveniaLow2.3EuropeSpainLow2EuropeSwedenModerate3.6EuropeSwitzerlandModerate4.1EuropeUkraineHigh6.1EuropeUnited KingdomModerate3.2Middle East-North AfricaAlgeriaVery high7Middle East-North AfricaBahrainHigh5.9Middle East-North AfricaEgyptVery high7.7Middle East-North AfricaIraqVery high6.6Middle East-North AfricaIsraelVery high7.5Middle East-North AfricaJordanHigh6.4Middle East-North AfricaKuwaitHigh6.2Middle East-North AfricaLebanonModerate4.1Middle East-North AfricaLibyaHigh6.1Middle East-North AfricaMoroccoVery high7Middle East-North AfricaOmanHigh5.1Middle East-North AfricaPalestinian territoriesModerate3.9Middle East-North AfricaQatarVery high6.6Middle East-North AfricaSaudi ArabiaVery high7.4Middle East-North AfricaSudanModerate3.9Middle East-North AfricaSyriaVery high7.8Middle East-North AfricaTunisiaHigh5.8Middle East-North AfricaUnited Arab EmiratesHigh6.3Middle East-North AfricaWestern SaharaHigh6.1Middle East-North AfricaYemenHigh6.2Sub-Saharan AfricaAngolaModerate4.3Sub-Saharan AfricaBeninLow1.8Sub-Saharan AfricaBotswanaLow1.6Sub-Saharan AfricaBurkina FasoModerate3.6Sub-Saharan AfricaBurundiModerate3.1Sub-Saharan AfricaCameroonModerate3.9Sub-Saharan AfricaCape VerdeLow1Sub-Saharan AfricaCentral African RepublicModerate4.3Sub-Saharan AfricaChadModerate3.8Sub-Saharan AfricaComorosHigh4.6Sub-Saharan AfricaCongo, Dem. Rep.Moderate3.2Sub-Saharan AfricaCongo, Rep.Moderate2.7Sub-Saharan AfricaDjiboutiModerate3.7Sub-Saharan AfricaEquatorial GuineaModerate4.3Sub-Saharan AfricaEritreaHigh5.7Sub-Saharan AfricaEswatiniModerate3.8Sub-Saharan AfricaEthiopiaModerate4.1Sub-Saharan AfricaGabonLow1Sub-Saharan AfricaGambiaLow1Sub-Saharan AfricaGhanaLow1.4Sub-Saharan AfricaGuineaModerate3.1Sub-Saharan AfricaGuinea-BissauLow1.3Sub-Saharan AfricaIvory CoastLow1.4Sub-Saharan AfricaKenyaModerate2.5Sub-Saharan AfricaLesothoModerate2.5Sub-Saharan AfricaLiberiaLow2Sub-Saharan AfricaMadagascarModerate3.1Sub-Saharan AfricaMalawiModerate2.7Sub-Saharan AfricaMaliModerate3Sub-Saharan AfricaMauritaniaVery high6.7Sub-Saharan AfricaMauritiusLow2Sub-Saharan AfricaMozambiqueModerate2.5Sub-Saharan AfricaNamibiaLow1.3Sub-Saharan AfricaNigerModerate3.7Sub-Saharan AfricaNigeriaHigh4.6Sub-Saharan AfricaRwandaModerate4.2Sub-Saharan AfricaSao Tome and PrincipeLow1.3Sub-Saharan AfricaSenegalLow1.3Sub-Saharan AfricaSeychellesModerate2.7Sub-Saharan AfricaSierra LeoneLow2.2Sub-Saharan AfricaSomaliaHigh5.4Sub-Saharan AfricaSouth AfricaLow1.1Sub-Saharan AfricaSouth SudanModerate2.5Sub-Saharan AfricaTanzaniaModerate4.2Sub-Saharan AfricaTogoModerate2.6Sub-Saharan AfricaUgandaModerate3.6Sub-Saharan AfricaZambiaLow2Sub-Saharan AfricaZimbabweModerate2.7 Note: Based on the Government Restrictions Index’s 10-point scale; scores of 0.0 to 2.3 are considered “low,” 2.4 to 4.4 are considered “moderate,” 4.5 to 6.5 are considered “high,” and 6.6 to 10.0 are considered “very high.” For details on how disputed territories are coded, read the Methodology. Source: Pew Research Center analysis of external data. Refer to the Methodology for details.“More Countries Had Elevated Levels of Social Hostilities Involving Religion in 2023” PEW RESEARCH CENTER Four of the world’s five major geographic regions had overall increases on the Social Hostilities Index (SHI) in 2023: the Americas, the Asia-Pacific region, Europe and the Middle East-North Africa region. Sub-Saharan Africa was the only region to register a decrease. Median levels of social hostilities involving religion rose in 4 out of 5 regions in 2023 Median scores on the Social Hostilities Index (SHI) Source: Pew Research Center analysis of external data. Refer to the Methodology for details.“More Countries Had Elevated Levels of Social Hostilities Involving Religion in 2023” PEW RESEARCH CENTER Median levels of social hostilities involving religion rose in 4 out of 5 regions in 2023 Median scores on the Social Hostilities Index (SHI) YearAmericasAsia-PacificEuropeMiddle East-North AfricaSub-Saharan AfricaWorld20070.31.71.23.70.41.020080.62.02.04.92.11.820090.41.81.74.20.61.220100.42.22.14.31.01.520110.62.22.35.41.51.820120.42.92.76.42.12.020130.12.22.45.81.31.720140.32.21.96.01.01.520150.22.32.15.31.72.020160.51.82.64.61.61.820170.42.12.64.32.22.120180.72.12.23.82.02.020190.71.82.23.71.71.720200.81.82.03.51.21.820210.81.91.93.61.31.620220.61.91.74.21.61.620230.82.52.04.51.51.6 Source: Pew Research Center analysis of external data. Refer to the Methodology for details.“More Countries Had Elevated Levels of Social Hostilities Involving Religion in 2023” PEW RESEARCH CENTER The median SHI score in the Middle East-North Africa region went up to 4.5 in 2023 from 4.2 in 2022. The increase was partially driven by a rising number of countries (seven, up from two) that experienced religion-related mob violence. For example, in the Palestinian territories in February, a Palestinian gunman killed two men from the Jewish settlement of Har Bracha, according to media reports. In retaliation, about 400 Israeli settlers attacked the Palestinian town of Huwara, resulting in one death, hundreds of injuries and destruction of property.9 (Both attacks counted as social hostilities in the Palestinian territories because they occurred in the West Bank.) Meanwhile, in southern Tunisia, the historic El Hamma Synagogue, which includes the tomb of a 16th-century rabbi, was attacked in mid-October by hundreds of rioters. The attackers torched the building and defaced its walls with graffiti, reportedly to protest a hospital bombing in Gaza. At year’s end, Tunisian authorities had not arrested anyone for the attack. The Asia-Pacific region’s median SHI score rose from 1.9 in 2022 to 2.5 in 2023, the second-highest score recorded for the region since 2007. (The peak was 2.9 in 2012.) As in the Middle East-North Africa region, more Asia-Pacific countries had incidents of mob violence against religious groups in 2023 (eight) than in 2022 (three). In Buddhist-majority Sri Lanka, for example, violent clashes occurred at the disputed Kurunthoormalai archaeological site, which both Buddhists and Hindus claim as the location of ancient temples belonging to their respective faiths. In mid-July, about 100 Sinhalese protesters (members of a Sri Lankan ethno-religious group that is mostly Buddhist) along with Buddhist monks, police officers and other officials tried to stop a Hindu ceremony at the site on the grounds that fire used in the ceremony would cause damage. Police stopped the fire and removed people from the site. In Armenia, which we include in Asia, there was mob violence against Jehovah’s Witnesses. In June, a large group of protesters attempted to interrupt a regional meeting of Jehovah’s Witnesses at a stadium by blasting noise through loudspeakers and throwing objects such as stones, firecrackers and food. Europe’s median SHI score increased from 1.7 in 2022 to 2.0 in 2023, partly because five more countries had religion-related terrorist activity than in the previous year. (All of these cases involved three or fewer casualties.) In Belgium, a Tunisian man fatally shot two Swedish citizens and injured another at a soccer match. The attacker, who claimed membership in the Islamic State group (ISIS), shared a video saying he was seeking to avenge recent burnings of the Quran in Sweden. In another incident, a French citizen of Iranian descent killed a German tourist and injured two others near the Eiffel Tower in Paris, later telling police he acted in revenge for events in Gaza and the killing of Muslims in Afghanistan. The attacker reportedly had pledged allegiance to the militant group ISIS in a prerecorded video, and after the attack he told police he was angry that France was an “accomplice to what Israel is doing” in Gaza. (This study categorizes an attack as religion-related if the perpetrators target a religious group or claim religious motivations. In determining whether the perpetrators belong to a terrorist group, the study relies primarily on the U.S. State Department’s list of foreign terrorist organizations.) The median SHI score for the Americas increased from 0.6 to 0.8, matching the region’s previous peak scores recorded in 2020 and 2021 – although in 2023 the Americas continued to have the lowest median score among all five regions. The small year-over-year increase stemmed, in part, from a rise in the number of countries in which religious groups conducted or helped fund “conversion therapy” programs in which violence was used in an attempt to coerce people to become heterosexual.10 In Guatemala, for example, the U.S. State Department reported that conversion therapy centers in mostly rural parts of the country, partially funded and organized by evangelical churches, used tactics including electroshock therapy and coerced sex acts against lesbian, gay and transgender people. (The increase in SHI scores in the Americas reflects mentions of conversion therapy, since 2022, in the State Department Human Rights Reports.) Meanwhile, sub-Saharan Africa’s median SHI score declined slightly from 1.6 to 1.5. This was the only region to experience declines in median levels on both the SHI and GRI in 2023. Still, the region contained the country with the world’s highest SHI score – Nigeria, whose score was 9.0, up from 8.7 the previous year. Nigeria saw a rise in the number of deaths from attacks by the militant groups Boko Haram and ISIS-West Africa, who targeted both Christians and Muslims, according to the U.S. State Department. Multiple, violent clashes between mainly Muslim herders and Christian farmers over land and resources in Nigeria also had an ethno-religious component. Additionally, there were attacks on religious groups by Nigerian bandits and criminal gangs during the course of the year. Social hostilities involving religion around the world in 2023 Level of social hostilities involving religion in each country and territory studied, as of 2023 Note: Based on the Social Hostilities Index’s 10-point scale; scores of 0.0 to 1.4 are considered “low,” 1.5 to 3.5 are considered “moderate,” 3.6 to 7.1 are considered “high,” and 7.2 to 10.0 are considered “very high.” For details on how disputed territories are coded, read the Methodology. Source: Pew Research Center analysis of external data. Refer to the Methodology for details.“More Countries Had Elevated Levels of Social Hostilities Involving Religion in 2023” PEW RESEARCH CENTER Social hostilities involving religion around the world in 2023 Level of social hostilities involving religion in each country and territory studied, as of 2023 RegionCountrySHI Category2023 SHI ScoreAmericasAntigua and BarbudaLow0AmericasArgentinaModerate2.4AmericasBahamasLow0.1AmericasBarbadosLow0.1AmericasBelizeLow1.1AmericasBoliviaLow0.8AmericasBrazilHigh4.7AmericasCanadaModerate3.3AmericasChileModerate1.5AmericasColombiaModerate1.9AmericasCosta RicaLow0.1AmericasCubaLow1AmericasDominicaLow0AmericasDominican RepublicLow0.8AmericasEcuadorLow0.9AmericasEl SalvadorLow1.1AmericasGrenadaLow0AmericasGuatemalaHigh3.8AmericasGuyanaLow0.1AmericasHaitiHigh4.4AmericasHondurasLow0.7AmericasJamaicaLow0.8AmericasMexicoHigh4.7AmericasNicaraguaLow0.2AmericasPanamaLow0.8AmericasParaguayLow1AmericasPeruLow0.4AmericasSt. Kitts and NevisLow0.1AmericasSt. LuciaLow0.1AmericasSt. Vincent and the GrenadinesLow0AmericasSurinameLow0AmericasTrinidad and TobagoLow1AmericasUnited StatesLow1.3AmericasUruguayLow1.1AmericasVenezuelaLow0.7Asia-PacificAfghanistanHigh7Asia-PacificArmeniaHigh4.5Asia-PacificAustraliaLow1.2Asia-PacificAzerbaijanLow0.8Asia-PacificBangladeshVery high7.8Asia-PacificBhutanLow1.1Asia-PacificBruneiModerate2Asia-PacificCambodiaLow0.2Asia-PacificChinaLow0.1Asia-PacificCyprusHigh5.4Asia-PacificEast TimorLow0.1Asia-PacificFijiLow0.4Asia-PacificHong KongLow0.1Asia-PacificIndiaVery high8.8Asia-PacificIndonesiaHigh6Asia-PacificIranHigh5.8Asia-PacificJapanModerate2.6Asia-PacificKazakhstanModerate2.8Asia-PacificKiribatiModerate1.5Asia-PacificKyrgyzstanModerate2.6Asia-PacificLaosHigh3.6Asia-PacificMacaoLow0.1Asia-PacificMalaysiaModerate3.1Asia-PacificMaldivesHigh3.8Asia-PacificMarshall IslandsLow0.8Asia-PacificMicronesia, Federated StatesLow0.2Asia-PacificMongoliaLow0.8Asia-PacificMyanmarModerate3Asia-PacificNauruLow0Asia-PacificNepalHigh6.2Asia-PacificNew ZealandModerate2.5Asia-PacificPakistanVery high7.5Asia-PacificPalauLow0Asia-PacificPapua New GuineaModerate2.5Asia-PacificPhilippinesModerate2.9Asia-PacificSamoaLow0.1Asia-PacificSingaporeLow1Asia-PacificSolomon IslandsLow0.3Asia-PacificSouth KoreaModerate2.6Asia-PacificSri LankaHigh6.3Asia-PacificTaiwanLow0Asia-PacificTajikistanModerate2Asia-PacificThailandHigh4.4Asia-PacificTongaLow0Asia-PacificTurkeyHigh4.3Asia-PacificTurkmenistanModerate3.5Asia-PacificTuvaluModerate2.2Asia-PacificUzbekistanModerate2.9Asia-PacificVanuatuLow0.3Asia-PacificVietnamModerate2.6EuropeAlbaniaLow1.3EuropeAndorraLow0EuropeAustriaModerate3.4EuropeBelarusLow0.2EuropeBelgiumHigh3.8EuropeBosnia and HerzegovinaModerate2.8EuropeBulgariaModerate2.9EuropeCroatiaLow0.3EuropeCzech RepublicModerate1.6EuropeDenmarkModerate1.7EuropeEstoniaLow1.1EuropeFinlandHigh3.7EuropeFranceHigh4.7EuropeGeorgiaHigh4.4EuropeGermanyHigh4.4EuropeGreeceLow1.3EuropeHungaryModerate2EuropeIcelandLow0.1EuropeIrelandLow1.1EuropeItalyHigh4EuropeKosovoModerate3.5EuropeLatviaLow0.7EuropeLiechtensteinLow0.8EuropeLithuaniaLow1EuropeLuxembourgLow0.1EuropeMaltaLow0EuropeMoldovaModerate2.1EuropeMonacoLow0EuropeMontenegroLow1.4EuropeNetherlandsModerate2.9EuropeNorth MacedoniaModerate3.1EuropeNorwayHigh4.2EuropePolandLow1.4EuropePortugalLow0.2EuropeRomaniaLow1.3EuropeRussiaHigh3.8EuropeSan MarinoLow0EuropeSerbiaModerate2.2EuropeSlovakiaModerate2.3EuropeSloveniaLow0.2EuropeSpainHigh3.7EuropeSwedenHigh4.5EuropeSwitzerlandModerate2.6EuropeUkraineHigh5.6EuropeUnited KingdomModerate2.8Middle East-North AfricaAlgeriaHigh3.9Middle East-North AfricaBahrainLow0.7Middle East-North AfricaEgyptHigh7.1Middle East-North AfricaIraqHigh6.8Middle East-North AfricaIsraelVery high8.4Middle East-North AfricaJordanHigh4.9Middle East-North AfricaKuwaitModerate2.4Middle East-North AfricaLebanonHigh6.2Middle East-North AfricaLibyaHigh7.1Middle East-North AfricaMoroccoLow1Middle East-North AfricaOmanModerate2.1Middle East-North AfricaPalestinian territoriesHigh6.7Middle East-North AfricaQatarLow1.2Middle East-North AfricaSaudi ArabiaModerate2.9Middle East-North AfricaSudanHigh5.7Middle East-North AfricaSyriaVery high8.1Middle East-North AfricaTunisiaHigh4.9Middle East-North AfricaUnited Arab EmiratesLow0.7Middle East-North AfricaWestern SaharaLow0Middle East-North AfricaYemenHigh4Sub-Saharan AfricaAngolaLow0.3Sub-Saharan AfricaBeninLow0.8Sub-Saharan AfricaBotswanaLow0Sub-Saharan AfricaBurkina FasoHigh6.7Sub-Saharan AfricaBurundiLow0.2Sub-Saharan AfricaCameroonHigh6.5Sub-Saharan AfricaCape VerdeLow0Sub-Saharan AfricaCentral African RepublicHigh5.4Sub-Saharan AfricaChadModerate2.8Sub-Saharan AfricaComorosLow0.5Sub-Saharan AfricaCongo, Democratic RepublicHigh4.9Sub-Saharan AfricaCongo, RepublicLow0.8Sub-Saharan AfricaDjiboutiLow0.4Sub-Saharan AfricaEquatorial GuineaLow0.8Sub-Saharan AfricaEritreaLow0.1Sub-Saharan AfricaEswatiniLow0.4Sub-Saharan AfricaEthiopiaModerate2.6Sub-Saharan AfricaGabonLow0.8Sub-Saharan AfricaGambiaModerate3.5Sub-Saharan AfricaGhanaLow1.3Sub-Saharan AfricaGuineaModerate2.5Sub-Saharan AfricaGuinea-BissauModerate1.6Sub-Saharan AfricaIvory CoastModerate1.5Sub-Saharan AfricaKenyaHigh4.6Sub-Saharan AfricaLesothoLow0.1Sub-Saharan AfricaLiberiaHigh5.1Sub-Saharan AfricaMadagascarModerate1.5Sub-Saharan AfricaMalawiLow1.3Sub-Saharan AfricaMaliHigh5.6Sub-Saharan AfricaMauritaniaModerate1.7Sub-Saharan AfricaMauritiusLow1.3Sub-Saharan AfricaMozambiqueHigh4Sub-Saharan AfricaNamibiaLow0.2Sub-Saharan AfricaNigerHigh5.1Sub-Saharan AfricaNigeriaVery high9Sub-Saharan AfricaRwandaLow0Sub-Saharan AfricaSao Tome and PrincipeLow0Sub-Saharan AfricaSenegalModerate2Sub-Saharan AfricaSeychellesLow0Sub-Saharan AfricaSierra LeoneHigh3.7Sub-Saharan AfricaSomaliaHigh4.5Sub-Saharan AfricaSouth AfricaModerate1.8Sub-Saharan AfricaSouth SudanModerate2.2Sub-Saharan AfricaTanzaniaHigh4.4Sub-Saharan AfricaTogoModerate1.7Sub-Saharan AfricaUgandaHigh4.2Sub-Saharan AfricaZambiaLow1.1Sub-Saharan AfricaZimbabweLow0.8 Note: Based on the Social Hostilities Index’s 10-point scale; scores of 0.0 to 1.4 are considered “low,” 1.5 to 3.5 are considered “moderate,” 3.6 to 7.1 are considered “high,” and 7.2 to 10.0 are considered “very high.” For details on how disputed territories are coded, read the Methodology. Source: Pew Research Center analysis of external data. Refer to the Methodology for details.“More Countries Had Elevated Levels of Social Hostilities Involving Religion in 2023” PEW RESEARCH CENTER RECOMMENDED CITATION:Majumdar, Samirah and Vivian Jacobs. 2026. “More Countries Had Elevated Levels of Social Hostilities Involving Religion in 2023.” Pew Research Center. doi: 10.58094/cv0d-0488.
Restrictions on religion rose in most regions in 2023 but declined in sub-Saharan Africa
Full Article
Original Source
Read the full article at Pewresearch →KhanList aggregates and links to publicly available news content. We do not host full articles from third-party sources. Always verify important information with original sources.