
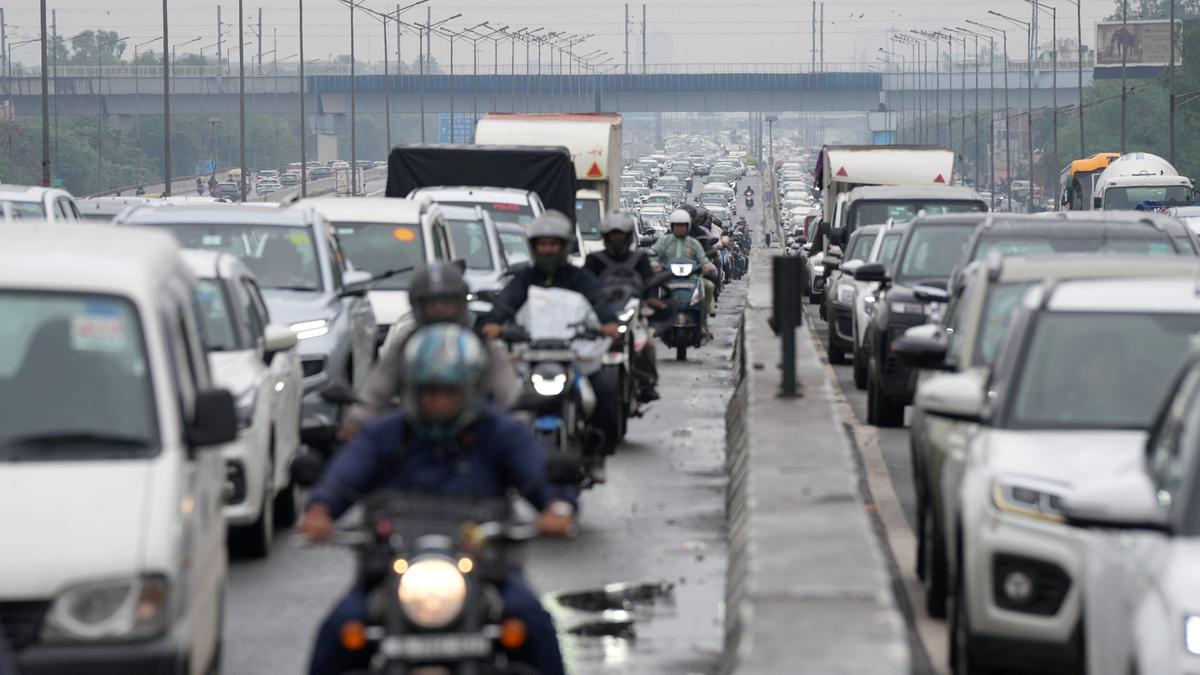
Qutab Road, Chirag Delhi and Baratooti Chowk are among the 10 locations contributing to Delhi’s persistent congestion, with commercial activity, roadside parking, freight movement, construction and poorly designed junctions emerging as some of the major reasons behind traffic bottlenecks, according to an analysis by ASTraM (Actionable Intelligence for Sustainable Traffic Management) shared with The Hindu.Also read | Delhi air ‘very poor’ with AQI reading of 364Qutab Road recorded the highest congestion among the 10 identified locations, at 59.10 km a day, followed by Chirag Delhi at 42.57 km and Baratooti Chowk at 38.90 km. Lothiyan Marg–Church Road, with 34.44 km, and Kalindi Kunj, with 30.76 km, completed the top five.The findings point to a problem that extends beyond the sheer volume of vehicles on Delhi’s roads, which is a common concern flagged by traffic officials on ground. At several locations, commercial establishments, wholesale markets, roadside parking, loading and unloading, and encroachments reduce the usable road space. At others, poorly channelled traffic, constrained approaches and conflicting movements at junctions contribute to queues.Markets, parking and junction design among major culprits Pedestrians on busy streets of Khari Baoli leading to Old Delhi spice market at night. | Photo Credit: Getty Images/iStockphoto Qutab Road emerged as a persistent congestion hotspot, ranking among the most congested locations in most months. The problem is attributed to high commercial activity, parking, loading and unloading, encroachments and heavy traffic demand. The suggested interventions include designated loading bays, parking and encroachment management, and a review of signal timings.Chirag Delhi, meanwhile, has witnessed a sharp deterioration. Its daily congestion length increased from around 23.6 km in September 2025 to more than 42 km in September 2026, a rise of nearly 79%. Peak-hour traffic, construction-related disruption and constrained approaches have been identified as the major factors. Signal optimisation, better channelisation and improvements to the junction’s geometry have been recommended.At Baratooti Chowk, wholesale-market activity, freight movement, roadside parking and encroachments contribute to congestion. Although the location recorded an improvement of around 21% over the previous year, it continues to figure among the worst-affected stretches. Timed freight operations and better parking management have been identified as possible solutions.Lothiyan Marg–Church Road recorded 34.44 km of daily congestion, with roadside parking and the movement of buses and heavy commercial vehicles contributing to the problem. At Kalindi Kunj, where congestion stood at 30.76 km a day, the convergence of traffic from multiple directions, bottleneck geometry and peak-hour demand were identified as the main concerns.The remaining locations in the list include IIT Flyover (26.79 km a day), Ajmeri Gate (26.56 km), Bhavbhuti Marg near New Delhi Railway Station (25.57 km), Chatta Rail Junction (24.78 km) and Saraswati Marg–DB Gupta Road (22.53 km).At IIT Flyover, the bottleneck is linked to the flyover’s approach, institutional traffic and peak-hour demand. Ajmeri Gate and Bhavbhuti Marg face a different set of challenges, with pedestrian movement, railway-station access, auto-rickshaws and e-rickshaws, and passenger pick-up and drop-off activity competing for road space.Chatta Rail Junction has been flagged for conflicting traffic movements and inadequate junction design, while commercial activity, mixed traffic, parking and encroachments contribute to congestion along Saraswati Marg–DB Gupta Road.Congestion rises 12.6% over a year, peaks at 3,341 km a day in February Heavy traffic congestion near the 12 Pula Flyover amid heightened security arrangements ahead of the 18th BRICS Summit, in New Delhi. | Photo Credit: ANI Delhi’s average daily congestion length increased by 12.6% between September 2025 and September 2026, rising from 2,405 km to 2,708 km, according to the monthly assessment.The AI-driven platform, that monitors more than 250 congestion points, including 62 priority hotspots, found that congestion peaked at 3,341 km a day in February 2026, nearly 39% higher than the September 2025 level, before declining over the following months. The platform was earlier implemented by the Bengaluru traffic police for traffic management and congestion mapping.Congestion fell to 2,144 km in March and 2,126 km in April, before reaching a low of 1,562 km a day in June. However, the respite was short-lived, with congestion rising again from July onwards to 2,411 km, followed by 2,736 km in August and 2,708 km in September.The October 2026 assessment subsequently recorded an improvement, with average daily congestion declining by about 8.6% to 2,474.49 km. It recorded a cumulative congestion length of 76,709 km and 161,876 congestion alerts, averaging 5,222 alerts a day, lower than the 5,983 daily alerts recorded in September.7 p.m. is Delhi’s peak congestion time New Delhi: Vehicles caught in a traffic jam on Bhishma Pitamah Marg near Jawaharlal Nehru Stadium in New Delhi on October 30, 2026. | Photo Credit: PTI Congestion remains relatively low in the early morning, begins rising after 8 a.m. and builds through the day, reaching its peak at around 7 p.m. The hourly congestion length rises to approximately 325 km at the evening peak before falling sharply thereafter.The pattern suggests that Delhi’s traffic pressure is not confined to the morning office commute. Evening commuter movement coincides with commercial activity, deliveries, freight movement, market traffic and other journeys, placing additional pressure on already constrained roads and junctions.Daily congestion levels also fluctuate significantly. In October, the recorded daily congestion length ranged from around 621 km on October 2 to 4,489.75 km on October 31, underlining the extent to which traffic conditions can vary from one day to another.More than half of monitored junctions show improvementA separate year-on-year comparison of 283 junctions in September 2025 and September 2026 found that 151 had improved. Average weekend congestion per junction declined by nearly 8%, from 1,596 km a day to 1,469 km a day.However, the overall average congestion per junction increased by 2.33%, from around 1,800 km a day to 1,842 km a day, indicating that improvements at individual locations have not necessarily translated into a reduction across the entire network.This comes even as Delhi’s vehicle population increased by 7.93% to 87.61 lakh, according to the Economic Survey of Delhi 2025–26.The analysis points to the need to distinguish between infrastructure and design deficiencies, operational shortcomings and enforcement gaps. The absence of designated loading areas, parking facilities, pedestrian crossings and passenger pick-up and drop-off spaces cannot be addressed through enforcement alone. Similarly, poorly timed signals, inadequate diversions and weak junction management require operational changes.It recommends a combination of optimised and adaptive traffic signals, coordinated junction management, designated loading and unloading spaces, improved pedestrian facilities, organised auto-rickshaw and e-rickshaw stopping areas, parking regulation and targeted restrictions on freight and heavy vehicles.The report also stresses the need for coordination among multiple agencies, including the Public Works Department, Municipal Corporation of Delhi, New Delhi Municipal Council, Delhi Metro Rail Corporation and National Highways Authority of India, as several congestion-related issues involve road design, construction, parking and public transport infrastructure.
Qutab Road, Chirag Delhi, IIT Flyover among Delhi’s 10 worst congestion hotspots; 7 p.m. is peak traffic hour
Full Article
Original Source
Read the full article at Thehindu →KhanList aggregates and links to publicly available news content. We do not host full articles from third-party sources. Always verify important information with original sources.