Published Aug 14, 2026, 3:00 PM EDT James lives and breathes route development. Educated in Air Transport Management at Loughborough University and Cranfield University, James has a PhD in airline strategy. James was Market Opportunity Analyst at London Luton Airport and Chief Analyst at anna.aero. He taught airline strategy and economics to undergraduate and postgraduate students for five years and has worked closely with multiple carriers on route and market intelligence projects. He is based near London, UK. When flights are considered, Southwest Airlines' five busiest airports in 2026 are Denver International Airport (DEN), Las Vegas' Harry Reid International Airport (LAS), Baltimore/Washington International Thurgood Marshall Airport (BWI), Chicago Midway International Airport (MDW), and Dallas Love Field (DAL). Things may vary in specific months. The five facilities are utterly critical to the self-described hybrid operator's overall operation. As OAG shows, they collectively have an average of 2,020 daily aircraft movements this year. More than one in every two of Southwest's services land and take off at these airports (51.3%). Given their significance, it is worth examining the worst-performing routes by load factor. Southwest's 11 Worst Routes From Its Five Busiest Airports Credit: Denver International Airport An airline's load factor (which is technically the seat factor) is only one performance measure, and it should not be considered in isolation. Obviously, the following markets performed poorly in this sense. However, it is always about how and why a specific result was achieved. Context is usually critical in better understanding the situation. In the 12 months to May 2026, the US Department of Transportation (DOT) shows that Southwest's average load factor across its entire network was 77.4%. The airline's results for its top five airports were DEN (80.3%), LAS (80.0%), MDW (79.6%), DAL (76.3%), and BWI (75.7%). The following 11 links had the lowest loads, some of which had a significant number of passengers, with a huge number of seats to continually fill. Each market had to have at least 2,000 round-trip passengers to be eligible for inclusion. This helped to rule out oddities or charter services or links that had only just started. For example, Southwest began flying from DEN to Santa Rosa in April 2026, initially with a weekly flight. However, that route, which had just started, only had 1,325 passengers, with a load factor of 60.5%. Let's give it time to develop. Load Factor (June 2025-May 2026)* Southwest Route Round-Trip Passengers** Comments 52.1% BWI to Jackson–Medgar Wiley Evers International Airport (JAN), Mississippi 38,622 Route ended in March 2026 55.7% DAL to Midland/Odessa, Texas 229,616 59.2% MDW to Tulsa, Oklahoma 78,892 59.7% DEN to Midland/Odessa, Texas 45,895 60.2% MDW to Wichita, Kansas 31,315 Route began in March 2026 61.3% MDW to Indianapolis, Indiana 121,671 Route resumed in August 2025 after a five-year absence 61.5% BWI to Raleigh/Durham, North Carolina 343,320 61.5% DAL to Tulsa, Oklahoma 198,205 61.8% DAL to Austin Bergstrom International Airport (AUS), Texas 448,159 61.9% MDW to Louisville, Kentucky 192,354 61.9% MDW to St. Louis, Missouri 343,483 * According to the DOT ** According to the DOT Loading map… Drag to explore Southwest From BWI To JAN The carrier originally flew between BWI and JAN from 1997 to 2013. The airline pulled out of JAN entirely the following year, only to return in 2021. OAG shows that flights from BWI resumed in 2021 but ended in March 2026. In the second attempt to make the route work, Southwest transported a total of 290,411 passengers, but only filled 64.3% of seats. Between June 2025 and May 2026, the DOT shows that barely half of the available seats were filled with passengers (52.1%). It was the airline's worst result from JAN in the examined period. However, the other two routes also had very low loads: Houston Hobby Airport (HOU) 64.8% and Nashville International Airport (BNA) 69.0%. Even when BWI's much longer distance is factored in, the route had a lower yield than HOU and BNA on a stage-length-adjusted (SLA) basis. No wonder it was dropped. The bigger question is why it continued for five years. Given the geographic location of BWI, perhaps it is unsurprising that fewer than one in four JAN passengers connected elsewhere via the Maryland airport. In many ways, BNA is a better option for the eastern US. Over 440,000 Passengers Flew DAL-AUS Credit: Shutterstock This very short route covers 164 nautical miles (304 km) each way. Despite this, it was far too long to feature in Southwest's shortest links list. It has been part of Southwest's network since 1977 and was, therefore, among the carrier's first-ever routes. In the 12 months to May 2026, a whopping 448,159 round-trip passengers were transported. It was Southwest's 75th most-trafficked route across the airline's entire network. The DOT shows that 161,337 of these passengers only flew between DAL and AUS. The remaining 286,822 connected to another service at DAL or AUS. The link continues to play an important role for network connectivity. And when the very short route's yield is SLA to Southwest's average length from DAL, which is 638 nautical miles (1,182 km), it had the highest yield. It was also within the top six for SLA total revenue per available seat mile. Despite the surprisingly low load of 61.8% (!), Southwest is perhaps pleased with the route overall, which usually has seven daily flights in each direction.
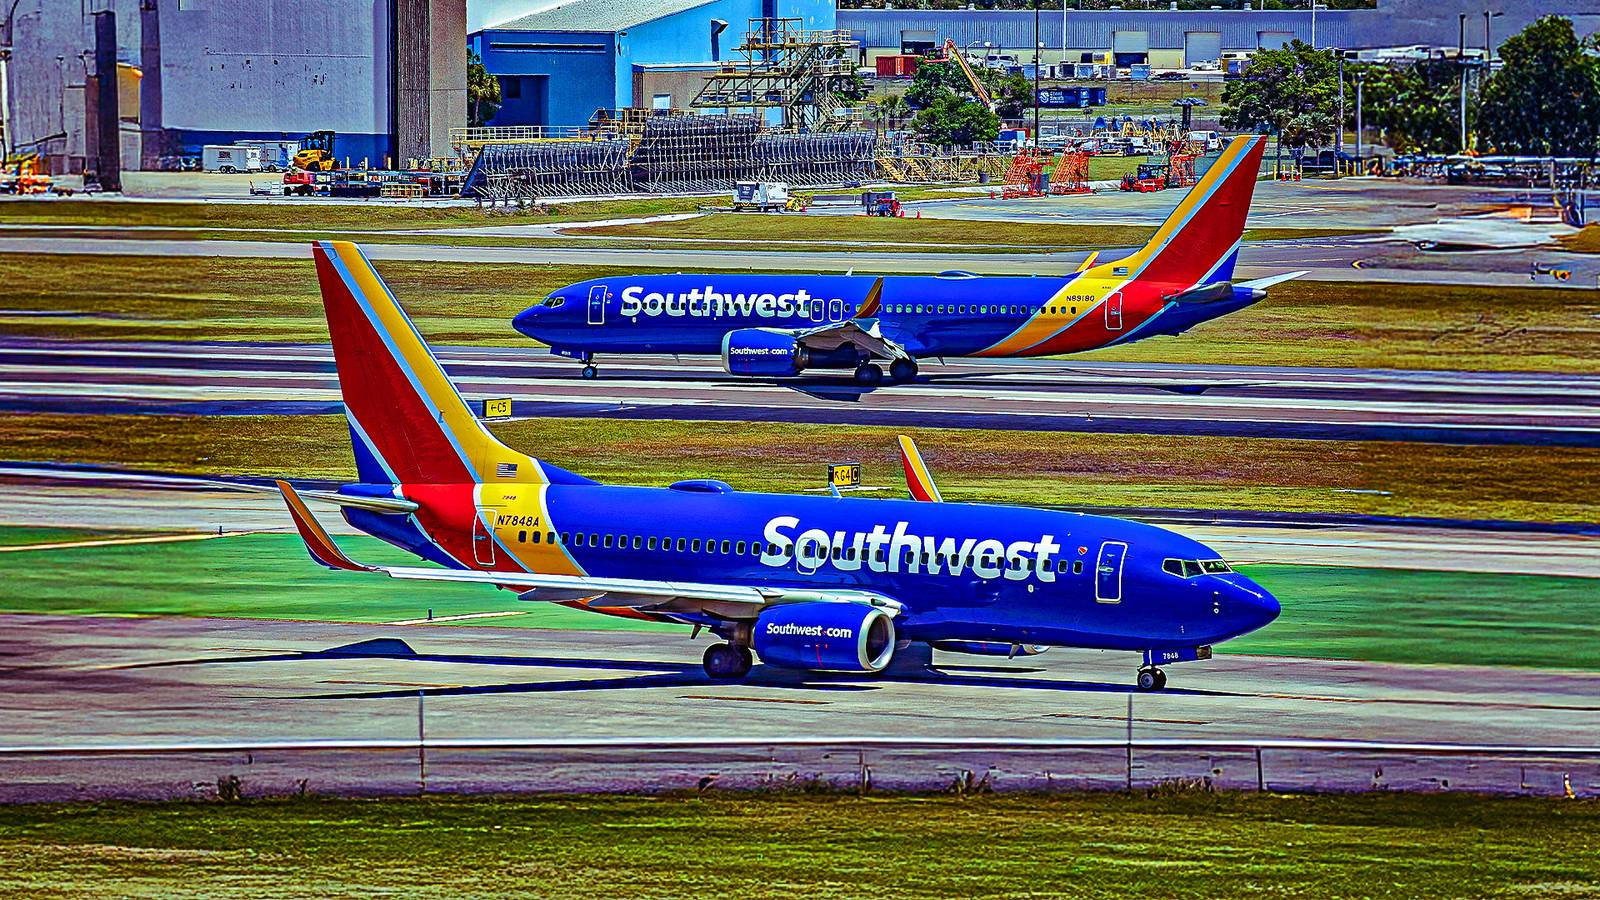
Only 52% Full: Southwest's 11 Shockingly Empty Routes From Its 5 Busiest Airports
Full Article
Original Source
Read the full article at Simpleflying →KhanList aggregates and links to publicly available news content. We do not host full articles from third-party sources. Always verify important information with original sources.