
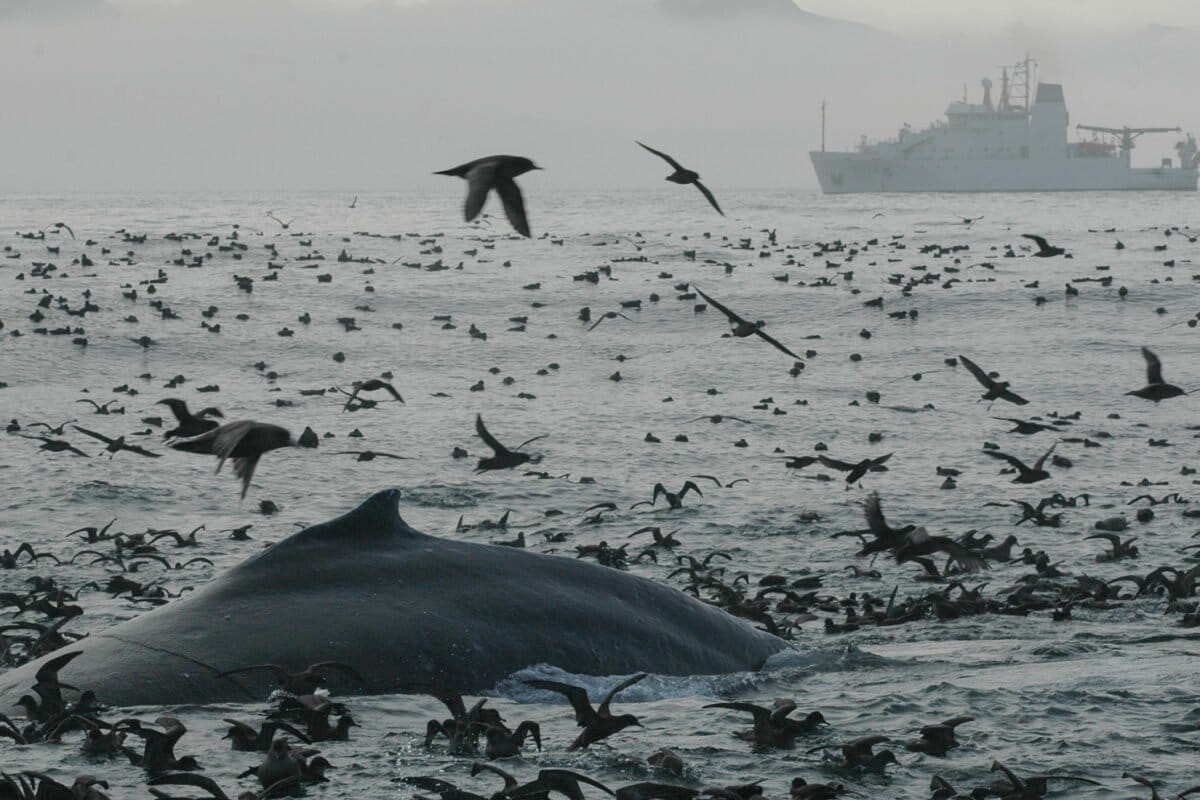
Using satellite data and water samples taken by ships over the last 40 years, researchers employed machine learning to untangle the history of marine heat waves hitting simultaneously with acidification events.They found that these compound events happen more frequently than would be expected by chance, attributing them to ocean physics that allow marine heat waves to become unusually acidic in some regions.The resulting database captured some “double-hit” heat-acidity events that have been largely ignored in the scientific literature, such as a massive 2016 event in the Southern Pacific Ocean that lasted eight months.Experts say more research is urgently needed to better understand how these compound events affect marine life and fisheries. Between 2014 and 2015, a marine heatwave known as “The Blob” warmed an area of the Pacific Ocean larger than the United States and Mexico combined. The massive event fueled toxic algae blooms, collapsed fisheries, killed off millions of emaciated seabirds, sent dead fin whales (Balaenoptera physalus) and sea otters washing up on Alaska and British Columbia coasts, and dotted California shores with starving sea lions. Though best known as a marine heat wave, The Blob was also an extreme acidification event. Yet occurrences of these compound heat-acidity extreme events remain poorly understood. A new study, published in the journal AGU Advances in August, provides a detailed look at the frequency, intensity and duration of these compound events during the last four decades. The study reveals an understudied aspect of marine heat waves that could have implications for the developing 2026-2027 “super” El Niño, in which waters in the equatorial Pacific become unusually warm due to changing wind patterns. An underweight sea lion pup on a beach in February 2015. Image by NOAA Fisheries West Coast. Researchers from the Swiss Federal Institute of Technology (ETH Zurich) found compound heat-acidity events across the globe happen together “more frequently than would be expected by chance,” they wrote. Instead, the researchers attributed their occurrence to underlying ocean physics that allow marine heat waves to become unusually acidic in some regions. These events are mostly short-lived and small, with 67% of the 500 identified events lasting less than three months and extending to an average size of around 500,000 square kilometers (193,051 square miles). A few, however, lasted much longer — 20 months, in the most extreme case — and spread across a far greater area. The researchers found heat-acidity events are “rare in the eastern equatorial Pacific and polar regions.” This finding confirms previous results, but “adds a couple of aspects to what we know about these compound extremes,” such as their connections with El Niño and La Niña events, Friedrich Burger, the author of a similar study who was not involved in the recently published study, told Mongbay by video. With rising atmospheric CO2 levels increasing ocean acidity and climate change intensifying marine heat waves, understanding how these extremes interact might be the first step in mitigating their consequences, particularly for fisheries, Antonietta Capotondi, a physical oceanographer and senior scientist at the University of Colorado in the U.S. who didn’t participate in the research, told Mongabay in a video interview. A grower tends to a cage of oysters (Crassostrea virginica) at an intertidal aquaculture farm. Ocean acidification affects the ability of oysters and other shellfish to build and maintain their calcium carbonate shells. Image by Eric Schrading/USFWS (Free to use). Filling in gaps, one pixel at a time Satellites have tracked ocean temperatures since the late 1970s, but that’s not the case for acidity, according to Burger, a postdoctoral researcher in ocean modeling at the University of Bern in Switzerland. The best acidity data comes from commercial ships with sensors that measure CO2 pressure in the water, which indicates the amount of dissolved CO2. (The chemical process CO2 undergoes when it dissolves in seawater is an important driver in determining ocean pH.) Because the data is limited to ship tracks, there are immense data gaps across different oceans. To fill those gaps, the team also looked at satellite data on other factors that could help them deduce ocean acidity indirectly, such as temperature, salinity and chlorophyll. “We use everything we can find,” Luke Gregor, one of the authors of the new study and a researcher at the Environmental Physics Group at ETH Zürich, told Mongabay by video. “We understand how pH responds to a change in [these] factors that we can measure with satellites. And combining all that with ships data, we can calculate the acidity,” Gregor said. The researchers used machine learning to estimate pH where no direct measurements existed, by predicting the missing data points based on indirect data and surrounding readings. The model created a global map of acidity conditions for each month — 504 maps in all for the period 1982 to 2024 — and overlaid the global pH data with the marine heat wave data. This approach left sea-ice-covered regions out of the analysis. Yet the available data surfaced some overlooked events, like a 2016 incident in the southwest Pacific Ocean that lasted four months and covered 4 million km2 (1.54 million mi2). Gregor said he thinks events like this one go unnoticed by researchers because they happen in the open ocean. “But that doesn’t mean that marine life isn’t affected,” he said. The fringing reef around Brisk Island off Queensland, Australia, shows heavy bleaching along the outer edge in 1998. Elevated ocean temperatures lead to coral bleaching, while ocean acidification can weaken corals. Image by J. Jones/Commonwealth of Australia (Reef Authority) (CC BY 4.0). Understanding the driving forces The study shows these compound extreme events are strongly tied to the intensity of “upwelling” in a given area. This natural process brings deep, cold, carbon-rich waters to the surface, cooling the ocean’s surface temperature but simultaneously making it more acidic, particularly in places like the equatorial Pacific and the Southern Ocean. During an El Niño, the winds that drive this upwelling in the Pacific stop or even reverse direction, blocking the cold, deep ocean water from rising. As a result, waters get warmer but less acidic, reducing the likelihood of a double-hit event. In regions without strong upwelling, the opposite pattern holds: Without that buffering exchange, heat and acidity increase together. The researchers found these extreme compound events are four times more likely to happen in regions where the ocean’s different layers don’t mix, and are often tied to specific periods in the El Niño and La Niña cycles. In areas bordering the equatorial Pacific, for example, the researchers found the likelihood of a compound heat-acidity extreme increases near the end of an El Niño cycle. But in the western tropical Pacific and Pacific regions closer to the poles, heat-acidity extreme events tend to be associated with La Niña conditions. Gregor said his team is closely following the current El Niño event, which is predicted to become the strongest ever recorded, to better understand “what does it mean for the future world when we have more El Niño events, or stronger El Niño events, in terms of acidification extremes.” A bleached Porites coral in the Great Barrier Reef off the coast of Magnetic Island, Australia, during a marine heat wave in 2020, when water temperatures were 32º Celsius (89.6º Fahrenheit). Image ©Victor Huertas/Greenpeace. Marine life: A blind spot All the researchers interviewed by Mongabay agreed that little is known about how compound events affect marine life, especially at the ecosystem level. This is an urgent question, said Capotondi, a physical oceanographer. “If we understand these linkages, you can then develop models that include biology and that also can account for these relationships, and then we may be in a better position to anticipate them,” Capotondi said, adding that this would allow managers and decision makers to act. Banner image: A humpback whale back surrounded by murres and other seabirds off the coast of Alaska. As warm waters reduced offshore krill, whales moved closer to the coast, where crab fishers set their traps and cast their nets, leading to a spike in whale entanglements. Image by NOAA via NPS.gov Collection (Free to use). Global ocean breaks records with 100 days of heat as El Niño adds new threat Global ocean acidification has passed safe planetary boundary threshold: Study Citations: Gregor, L., … Gruber, N. (2026). Recent history of surface ocean acidification extremes that compound marine Heatwaves. AGU Advances, 7(5). doi:10.1029/2025av002112 Burger, F. A., Terhaar, J., … Frölicher, T. L. (2022). Compound marine heatwaves and ocean acidity extremes. Nature Communications, 13(1). 4722.doi:10.1038/s41467-022-32120-7 Feedback: Use this form to send a message to the editor of this post. If you want to post a public comment, you can do that at the bottom of the page. Credits Topics
New global maps chart 40 years of ocean heat and acidification extremes
Full Article
Original Source
Read the full article at News →KhanList aggregates and links to publicly available news content. We do not host full articles from third-party sources. Always verify important information with original sources.