
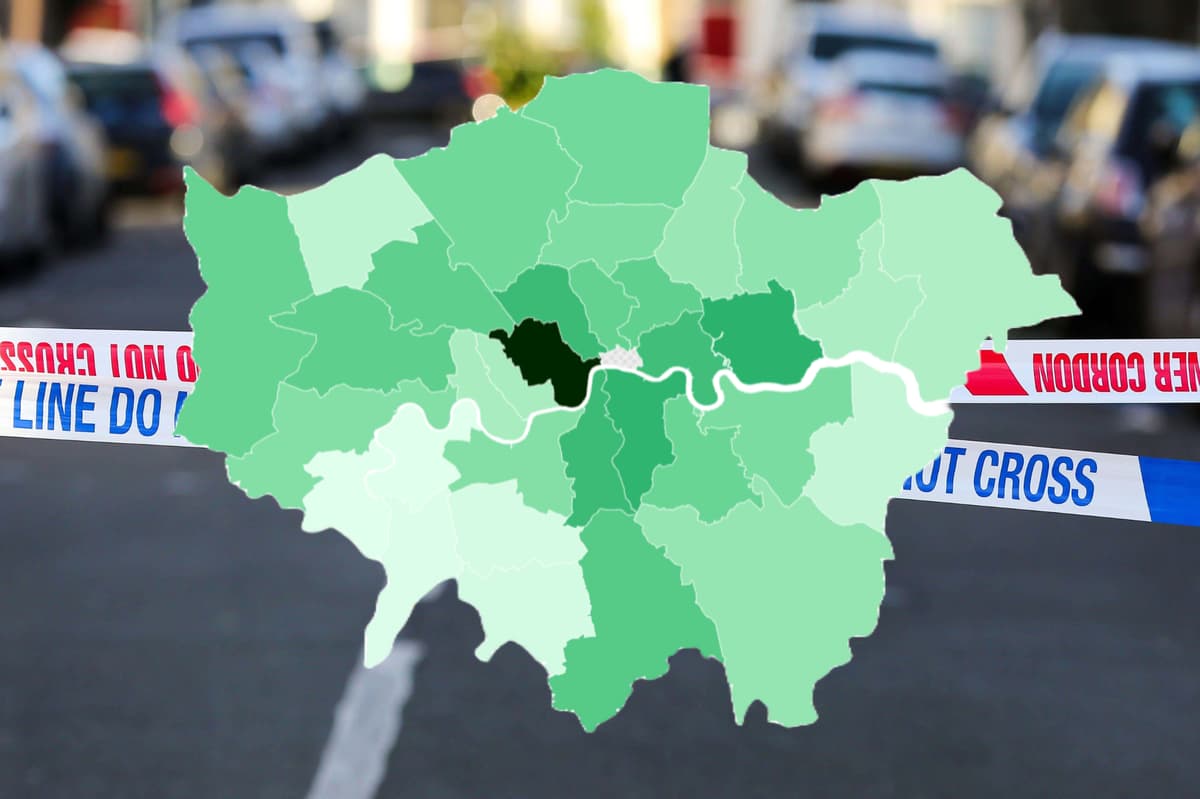
Crime statistics released by the Metropolitan Police sheds light on which parts of London have seen the highest levels of crime in the past year.The data shows that a total of 917,809 crimes were logged in the capital between September 2025 and August 2026 - down 2.3% on the previous year.According to the figures, taken from the Met’s monthly crime data statistics, Westminster was the borough with comfortably the most crimes recorded, with 74,464 logged since September last year.It was also the borough with the highest number of crimes recorded per person, with 273.1 crimes per 1,000, according to the data.The borough did, however, see the biggest decline in crime of any borough in the past year.There was a 17.41% drop from last year, when 90,159 total crimes were recorded in the area.Newham was the borough with the second most offences recorded, with 42,038, followed by Southwark with 41,486 and Camden with 39,541.South-west London saw the least amount of crime - Richmond, Kingston, Merton and Sutton took the bottom four spots in the rankings.Crimes logged each month since September 2022Met PoliceDespite the overall drop in crime in the capital, a number of boroughs did see crime levels rise in the past year.Tower Hamlets saw the biggest year-on-year increase, up 4.35%, ahead of Lewisham where crime levels rose 4.34%.There were also sizeable increases in Barnet, Redbridge, Kingston and Sutton.As well as Westminster, many boroughs saw huge drops in crime over the past year.In Kensington and Chelsea, crime levels dropped by 10.58%.Camden, Haringey, Richmond, Merton and Waltham Forest all also saw crime offences fall by over 5%.Crimes recorded in London between September 2025 and August 2026Met PoliceTheft was the most common offence in London, with 284,062 offences logged during the period. The number of thefts year-on-year has fallen dramatically, however, down 8.7% from 311,101 total cases the previous year.Violence against the person is second, with 258,143 cases - up 7.3% from the same period last year (240,617 cases).Despite ranking only seventh in total crimes, Croydon saw the most cases of violence against the person, with 11,512.Read MoreVehicle crimes were the third most common in the capital, but fell by 7.1% from the previous year.Newham and Ealing recorded the most vehicular crimes, with 4,886 and 4,302 logged respectively.Drug related offences also fell sharply, down 9.9% from the previous 12 months. 3,050 cases were logged in Westminster, followed by 2,484 in Brent and 2,407 in Newham.Westminster, Lambeth and Croydon saw the highest number of sexual offences over the past year.
Is crime going up or down in your London borough? Check our interactive map to find out
Full Article
Original Source
Read the full article at Standard →KhanList aggregates and links to publicly available news content. We do not host full articles from third-party sources. Always verify important information with original sources.