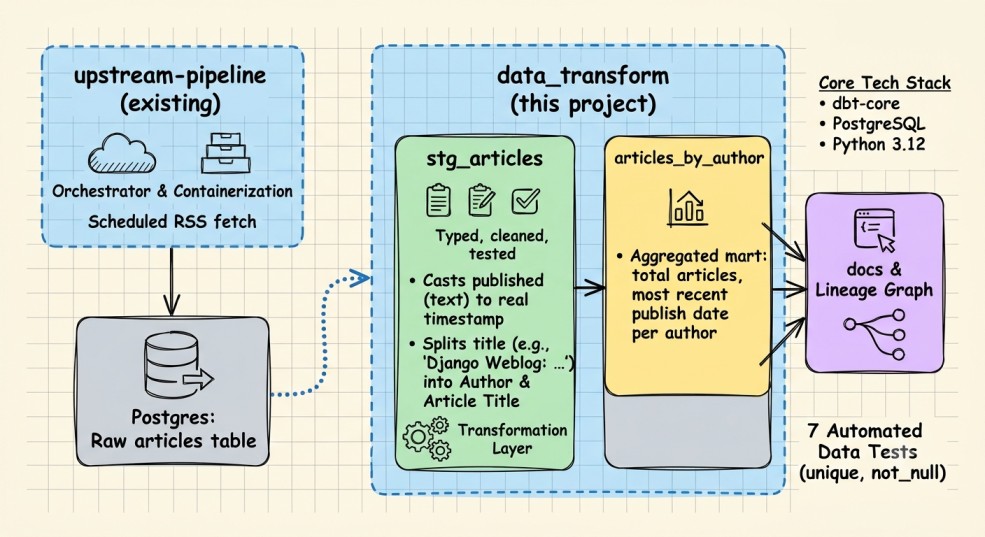
, I gave myself a 12-month roadmap to go from data analyst to data engineer. I’m only about two months into it. In that short stretch I’ve already built two ETL pipelines from scratch, the first one pulling GitHub repo data into SQLite, the second one pulling RSS articles into PostgreSQL with Docker and Kestra handling the orchestration. I wrote about scheduling that second pipeline to run automatically every hour, and at the time, that felt like a real milestone. The data was flowing in on its own, no manual runs, no me remembering to trigger anything. But somewhere between writing that article and starting this one, I ran a query on my own data and realized something. I couldn’t sort my articles by date properly. I couldn’t tell which blogs were publishing the most. The data had been sitting in Postgres for weeks, technically “loaded,” and I hadn’t actually looked at it closely until I needed it for something. Turns out I’d built two pipelines and skipped the part that makes the data useful. Extract, load, and then nothing. No transformation, no modeling, no real structure past “it’s in a table now.” This article is about fixing that. I finally sat down and learned dbt, and in the process learned what “analysis ready” actually means, because it turns out loading data and having usable data are two very different things. The Data Was Loaded. It Just Wasn’t Usable. Here’s what my articles table actually looked like once I stopped and paid attention to it. The schema itself was simple, honestly about as simple as a table can get: CREATE TABLE IF NOT EXISTS articles ( id TEXT PRIMARY KEY, title TEXT NOT NULL, link TEXT NOT NULL, summary TEXT, published TEXT ); Notice that last column. published is a TEXT field. Not a timestamp, not a date, just a plain string that happened to look like a date if you squinted at it. When I queried the ten most recent articles, this is what came back: title | published ----------------------------------------------------------+--------------------------------- Django Weblog: Last Call 2026 Django Developer Survey | Wed, 08 Jul 2026 19:31:21 +0000 Mike Driscoll: New Book Release: Python Typing | Wed, 08 Jul 2026 18:46:18 +0000 That looks fine at a glance. It’s readable. But try to actually do anything with it. Want the articles from the last 7 days? You can’t filter on that without casting it first, every single time, in every single query. Want to sort chronologically and trust the order? Text sorting and date sorting aren’t the same thing, and depending on the format, they can quietly disagree with each other. Then there was the second problem, the one I almost missed entirely because it was hiding in plain sight. Look at those titles again: Django Weblog: Last Call 2026 Django Developer Survey Mike Driscoll: New Book Release: Python Typing Every single title in this feed follows the same pattern. Author or blog name, a colon, then the actual headline. That’s real, structured information sitting inside a single text field, completely unusable as a filter or a group-by. I couldn’t answer a question as simple as “which blogs post the most on Planet Python” because that information wasn’t a column. It was just text, buried. So that was the actual state of things. Two pipelines built, data flowing in on schedule, and I still couldn’t answer basic questions about my own data. Loading it was never the finish line. I just hadn’t gotten to the starting point yet. Why dbt, Specifically My first instinct was to just fix this in Python, since that’s the tool I already trust. Write a script that reads from articles, parses the dates, splits the titles, writes the results into new columns or a new table. And that would have worked, technically. But the more I thought about it, the more that felt like patching the same hole I’d already dug twice. Both of my pipelines were extract and load, full stop, and if I bolted transformation logic onto a Python script again, I’d just be adding a third untested, undocumented step to a system that already had two. I wouldn’t be learning anything new. I’d just be writing more of the same thing I already knew how to write. dbt does this differently, and that difference is kind of the whole point of the tool. Instead of a script that runs once and produces some output you have to trust blindly, dbt models are SQL that gets version controlled, tested, and documented as part of the same workflow. You write a transformation, and in the same project you can assert things about it: this column should never be null, this ID should always be unique. If those assumptions break, you find out immediately, not three weeks later when a chart looks wrong and you have no idea why. It also matches how the industry actually works. Every data engineering job post I’ve looked at over the past two months mentions dbt, or something dbt-shaped. Learning it wasn’t just about fixing my RSS data, it was about learning the tool that’s become the default way teams handle the “T” in ETL. So instead of another Python script, I decided to actually sit down and learn dbt properly, on data I already had, with problems I already understood. Here’s how that went. Setting Up (and Immediately Hitting a Wall) Getting dbt installed should have been the boring part. It wasn’t. I tried pip install dbt-postgres and got a wall of dependency resolution errors, dbt-core had no matching distribution for my environment. Turns out I was running Python 3.14, which is new enough that dbt hadn’t caught up to it yet. dbt Core officially supports up to 3.13 right now, and there’s usually a lag before it supports whatever Python just released. The fix wasn’t complicated once I understood the actual problem, install an older, supported Python version alongside my existing one, and build a virtual environment specifically for dbt using that: py -3.12 -m venv dbt-env dbt-env\Scripts\activate pip install dbt-postgres That’s a small thing, but it’s the kind of small thing that eats an hour if you don’t know to look for it, and I think it’s worth including here because it’s exactly the kind of setup friction that doesn’t show up in tutorials. Tutorials assume your environment already works. Mine didn’t, and I’d guess I’m not the only one running a Python version that’s ahead of what dbt currently supports. Once that was sorted, connecting dbt to my existing Postgres database (already running locally in Docker from my RSS pipeline) was straightforward. dbt init, pick postgres, plug in the host, port, credentials, and database name, and dbt debug confirms the connection: All checks passed! With that, I had a dbt project sitting on top of the same Postgres instance my RSS pipeline had been writing to for weeks. Time to actually fix the data. Building the Staging Model The first real dbt concept I had to understand was the difference between a source and a model. My raw articles table isn’t something dbt built, it’s external data that already exists, so dbt calls it a source. I defined that in a sources.yml file, which is really just dbt’s way of formally acknowledging “this table exists, and I depend on it”: sources: - name: rss_pipeline schema: public tables: - name: articles From there, I built my first actual model, stg_articles, a staging model whose entire job is to clean up the raw data without doing anything fancy yet. This is where both of my original problems got fixed in the same file. For the date: to_timestamp(published, 'Dy, DD Mon YYYY HH24:MI:SS OF') as published_at For the buried author name: split_part(title, ':', 1) as author, trim(substring(title from position(':' in title) + 1)) as article_title I ran dbt run, then went and actually queried the result instead of assuming it worked: published_raw published_at Sun, 05 Jul 2026 16:29:47 +0000 2026-07-05 16:29:47+00 Real timestamps. And when I checked the author split: author | article_title Python Software Foundation | Python Packaging Council Inaugural Election Dates Clean separation, even on titles with more than one colon in them, like a PyCoder’s Weekly issue title that had a colon in both the source name and the headline itself. The split logic only breaks on the first colon, so it held up fine. Adding Tests This is the part that made the whole project feel less like “I wrote some SQL” and more like actual engineering. I added tests directly in a schema file next to the model: columns: - name: article_id tests: - unique - not_null - name: published_at tests: - not_null Running dbt test doesn’t just check that the SQL runs, it checks that my assumptions about the data actually hold: PASS=4 WARN=0 ERROR=0 SKIP=0 NO-OP=0 REUSED=0 TOTAL=4 That not_null test on published_at specifically is the one that would have caught it if my date format string had been wrong. Instead of silently producing nulls I might not notice for weeks, I’d have seen a failed test the moment I ran it. Building a Mart, and Finally Asking a Real Question With clean staging data in place, I built one more model on top of it, articles_by_author, which aggregates the data into something I could actually ask a question of: which blogs post the most, and how recently. select author, count(*) as total_articles, max(published_at) as most_recent_article, min(published_at) as earliest_article from {{ ref('stg_articles') }} group by author order by total_articles desc That ref() function instead of source() matters here, it’s how dbt knows this model depends on stg_articles, not on the raw table directly. That dependency tracking is what builds the lineage graph later. The result was the first genuinely new thing I could see in this data since I started collecting it two months ago: author total_articles most_recent_article Python Software Foundation 5 2026-07-09 14:11:06+00 Django Weblog 4 2026-07-08 19:31:21+00 A question I couldn’t answer a week earlier, answered in one query, on data I’d already had sitting around the whole time. Seeing the Whole Thing The last step was running dbt docs generate and dbt docs serve, which builds an interactive documentation site with a lineage graph, basically a visual map of how data flows through the project. Mine showed exactly three connected nodes: Where This Leaves Me So that’s the project. Two clean models, seven passing tests, and a lineage graph that actually shows a real chain from raw data to something I can ask questions of. Compared to where I started this piece, unable to sort by date or tell which blogs posted the most, that’s a real shift, even if the underlying dataset didn’t change at all. Same data. Very different usefulness. I want to be honest about what this isn’t, though. This is still running entirely on my own machine. The Postgres database, the dbt project, all of it lives locally in Docker, which means none of this exists anywhere the moment my laptop is off. There’s also only one RSS feed feeding into this right now, so “which blogs post the most” is a fairly small question with a fairly small dataset behind it. And I haven’t touched anything around alerting or monitoring if a test starts failing quietly in the background. None of that takes away from what I actually learned here, though. I think there’s a difference between a project being finished and a project having taught you what it was supposed to teach you. This one did the second thing. I understand the difference between a source and a model now. I understand why tests aren’t optional if you actually want to trust your own data. And I understand, in a very concrete way this time, why “the data is loaded” and “the data is usable” are two completely different claims. The next problem is obvious, honestly. Everything I built here still depends on my laptop being on and Docker running. That’s the next wall I’m going to hit, and probably the next thing I write about, taking this whole stack off my machine and putting it somewhere it can actually run without me. Two months into a twelve month roadmap, and I think that’s about right. Slower than I’d like some days, but every wall I’ve hit so far has taught me something I couldn’t have learned by reading about it first. Thanks for reading! This is part of my ongoing series documenting my transition from systems analyst to data engineer. If you’ve been following along, thank you. Connect with me on LinkedIn, YouTube, and Twitter.
I Thought Loading Data Was the Finish Line. It Was the Starting Point.
Full Article
Original Source
Read the full article at Towardsdatascience →KhanList aggregates and links to publicly available news content. We do not host full articles from third-party sources. Always verify important information with original sources.