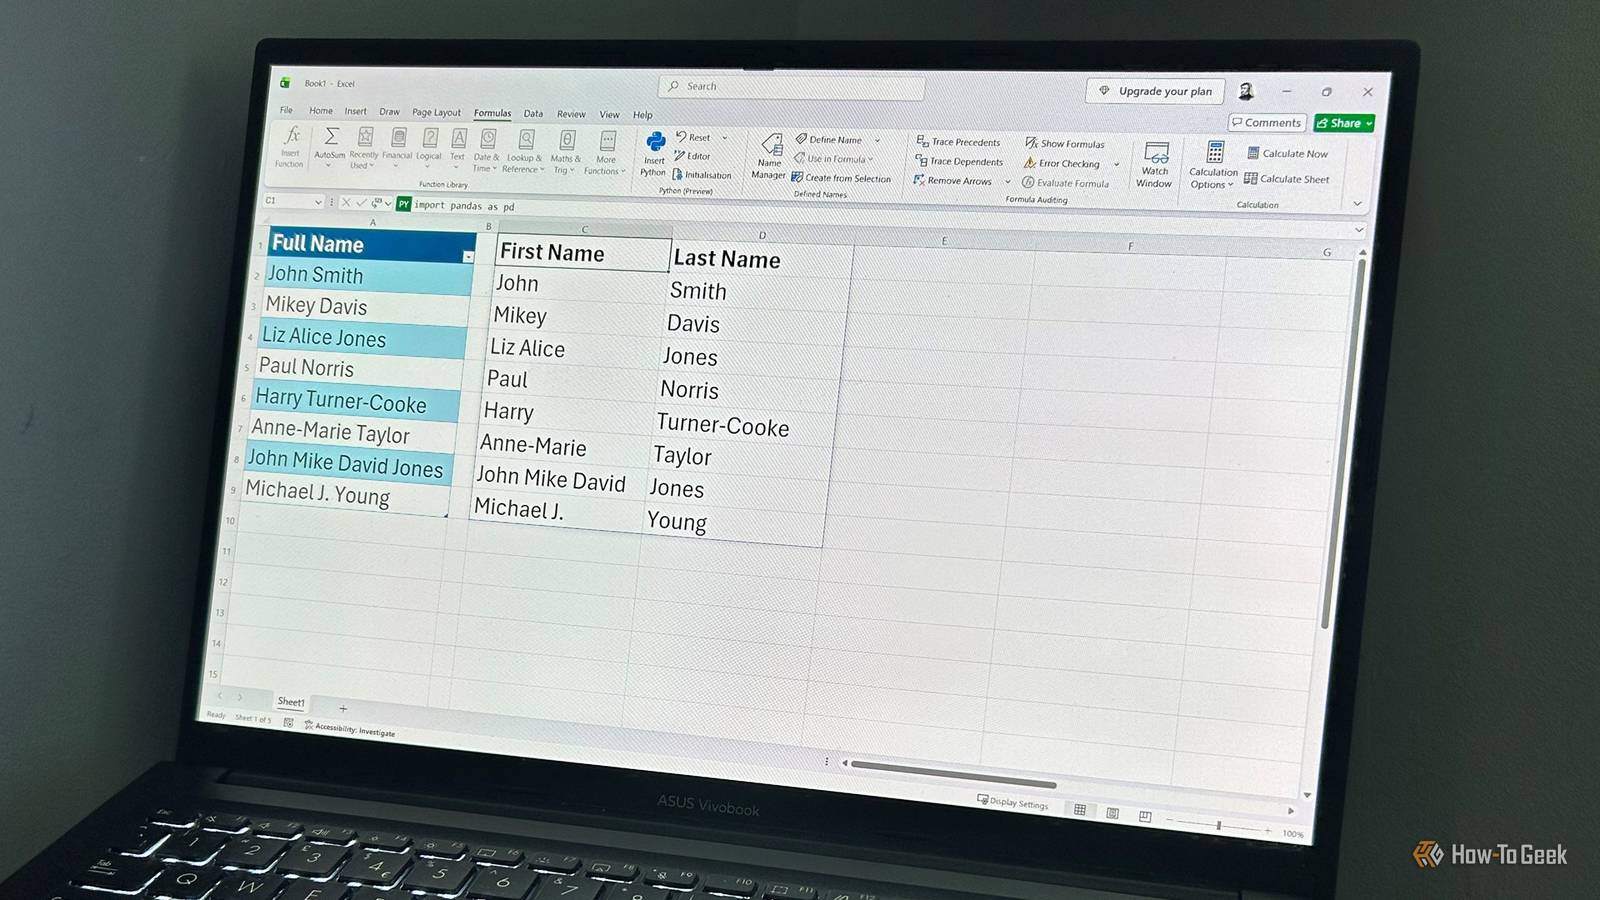
Published Jul 27, 2026, 7:30 AM EDT Tony Phillips is an experienced Microsoft Office user with a dual-honors degree in Linguistics and Hispanic Studies. Prior to starting with How-to Geek in January 2024, he worked as a document producer, data manager, and content creator for over ten years, and loves making spreadsheets and documents in his spare time. Tony is also an academic proofreader, experienced in reading, editing, and formatting over 3 million words of personal statements, resumes, reference letters, research proposals, and dissertations. Before joining How-To Geek, Tony formatted and wrote documents for legal firms, including contracts, Wills, and Powers of Attorney. Tony is obsessed with Microsoft Office! He will find any reason to create a spreadsheet, exploring ways to add complex formulas and discover new ways to make data tick. He also takes pride in producing Word documents that look the part. He has worked as a data manager in a secondary school in the UK and has years of experience in the classroom with Microsoft PowerPoint. He loves to encounter problems in Microsoft Office and use his expertise and legal-level training to find solutions. Outside of the Microsoft world, Tony is a keen dog owner and lover, football fan, astrophotographer, gardener, and golfer. Most people assume Python in Excel is something you use for complex data analysis. I found it useful for a much simpler reason: it helped me deal with the spreadsheet jobs I normally leave until later. Splitting messy names, comparing lists, and turning numbers into written insights became much easier without relying on complicated formulas or Power Query. What is Python in Excel, and why should you care? A simpler way to handle awkward spreadsheet jobs Python is built directly into Excel, meaning you don't need a separate Python installation to use the feature. When you run a Python formula, Excel executes the code in Microsoft's cloud infrastructure and returns the result straight to your cells. What's more, Python in Excel is designed to work with data from your worksheet or through Power Query, rather than accessing files directly from your computer. Python in Excel includes an Anaconda-provided environment containing popular libraries such as pandas, which makes manipulating and analyzing structured data much easier without requiring any setup. Think of Python in Excel less as learning a programming language and more as having another tool for handling the spreadsheet jobs that are difficult to solve with traditional formulas. While writing your own Python scripts takes some programming knowledge, you don't need that to get started. Every example below can be adapted to your own data, and I'll explain what each section of code does along the way. To try it out, you need a qualifying Microsoft 365 subscription and some data in your worksheet. Formatting your data as an Excel table (Ctrl+T) can make it easier to reference in Python, but you can also use cell ranges. Type =PY( in a cell (or click Insert Python in the Formulas tab) to start writing Python code, then use xl("Table Name") or xl("Cell References") to bring your worksheet data into Python. Your results can then be returned directly to Excel cells. Handle the edge cases with ease One spreadsheet task I regularly found myself avoiding was splitting full names into separate first- and last-name columns. It sounds simple at first, but when the data includes middle initials, double-barreled names, or hyphenated surnames, things start to get messy. Traditional text formulas like LEFT, RIGHT, and FIND can handle straightforward examples, but the logic quickly becomes difficult to maintain when names don't follow the same pattern. Power Query is another option, but I found myself having to adjust the steps whenever the format of the names changed. Python gave me a way to define my own rules for this type of cleanup. This example uses a simple rule-based approach rather than attempting to handle every possible naming convention: import pandas as pd df = xl("T_Names") def split_name(name): parts = name.split() if "-" in parts[-1]: return " ".join(parts[:-1]), parts[-1] if len(parts) == 2: return parts[0], parts[1] return " ".join(parts[:-1]), parts[-1] result = df.iloc[:, 0].apply(split_name) pd.DataFrame(result.tolist(), columns=["First Name", "Last Name"]) Because I referenced an Excel table, the Python formula continues to use the updated table data. Add a new row to the table, and the result automatically refreshes to include it. Here's what's happening: Code What it does import pandas as pd Loads the standard data analysis library used for working with tables. df = xl("T_Names") Pulls the Excel table named T_Names into Python. df.iloc[:, 0] Selects the first column of the imported table so Python can process each name individually. def split_name(name): Defines custom rules that treat the final word as the surname while preserving multi-word first names and hyphenated surnames. pd.DataFrame(..., columns=[...]) Packages the final split names into two neat columns for Excel to display. Microsoft 365 Personal OS Windows, macOS, iPhone, iPad, Android Free trial 1 month Microsoft 365 includes access to Office apps like Word, Excel, and PowerPoint on up to five devices, 1 TB of OneDrive storage, and more. Python compared two lists without the usual cleanup work Instantly see what's been added, removed, or stayed the same When I needed to compare before-and-after lists, my usual options were helper columns, lookup formulas, or Power Query merges. They all worked, but they became harder to manage as the lists grew. In this example, a few lines of Python were enough to identify what had been added, removed, or unchanged between two inventory lists. Because this approach uses sets, it works best when comparing unique items where duplicates don't need to be tracked: import pandas as pd old = set(xl("T_Old").iloc[:, 0]) new = set(xl("T_New").iloc[:, 0]) results = [] for item in sorted(old | new): if item in old and item in new: status = "Unchanged" elif item in new: status = "Added" else: status = "Removed" results.append([item, status]) pd.DataFrame(results, columns=["Item", "Status"]) Here's how the code works: Code What it does old = set(xl("T_Old").iloc[:, 0]) / new = set(xl("T_New").iloc[:, 0]) Pulls the items from both Excel tables into Python and converts them into sets, making it easier to compare which entries appear in each list. sorted(old | new) Combines both sets into one complete list of unique items and sorts the results alphabetically. if item in old and item in new: status = "Unchanged" Checks whether an item appears in both lists and marks it as "Unchanged." elif item in new: status = "Added" Identifies items that only appear in the new list and marks them as "Added." else: status = "Removed" Identifies items that only appear in the old list and marks them as "Removed." pd.DataFrame(results, columns=["Item", "Status"]) Converts the Python results into a new dataset that spills into your Excel worksheet. I then used Excel's conditional formatting tools to highlight the results. Python handled the comparison logic, while Excel's built-in formatting tools made the final output easier to scan. Python can also style returned DataFrames, but for a simple status report like this, Excel's conditional formatting was the quickest way to make the changes obvious. Python saved me from rewriting the same monthly report every time Turn changing numbers into a summary that updates with your data Writing monthly reports was one of those spreadsheet jobs I always knew I needed to do, but never looked forward to. My options were manually calculating the changes, copying figures into a document, or building increasingly complicated formulas to turn numbers into sentences. I could also use AI to help write the summary, but I would still need to verify that the calculations and conclusions matched the data. Python gave me a way to create a repeatable summary directly from the workbook, based on the rules and calculations I defined. Here's the code I used: import pandas as pd df = xl("T_Budget") df.columns = ["Category", "Last Year", "This Year"] df["Change"] = df["This Year"] - df["Last Year"] largest_up = df.loc[df["Change"].idxmax()] largest_down = df.loc[df["Change"].idxmin()] total_last = df["Last Year"].sum() total_this = df["This Year"].sum() pct = (total_this - total_last) / total_last * 100 summary = ( f"Household spending changed by {pct:.1f}% compared with last year. " f"{largest_up['Category']} experienced the biggest increase, " f"while {largest_down['Category']} decreased the most." ) summary Here's the breakdown: Code What it does df = xl("T_Budget") Imports the T_Budget table into Python as a pandas DataFrame. df.columns = ["Category", "Last Year", "This Year"] Names the imported columns so they are easier to reference in the code. df["Change"] = df["This Year"] - df["Last Year"] Calculates the difference for each category. Increases appear as positive numbers, while decreases appear as negative numbers. .idxmax() / .idxmin() Finds the categories with the largest increase and decrease automatically. f"Household spending changed..." Builds a readable summary using the calculated results. This is only a simple example of what is possible. When I built this, I could have extended the same logic to include individual category changes, spending alerts, or different summary formats depending on the type of report I needed. Python has a place in everyday spreadsheets These examples showed me that Python in Excel doesn't need to be reserved for complex data projects. It can be a practical way to deal with the spreadsheet jobs I previously found awkward, repetitive, or time-consuming when handled with traditional tools. If you want to explore more possibilities, other projects you can try with Python in Excel include cleaning up inconsistent spacing and capitalization, standardizing messy dates, creating charts, and exploring other text-analysis workflows.
I started using Python in Excel for boring tasks, and it completely changed my workflow
Full Article
Original Source
Read the full article at Howtogeek →KhanList aggregates and links to publicly available news content. We do not host full articles from third-party sources. Always verify important information with original sources.