
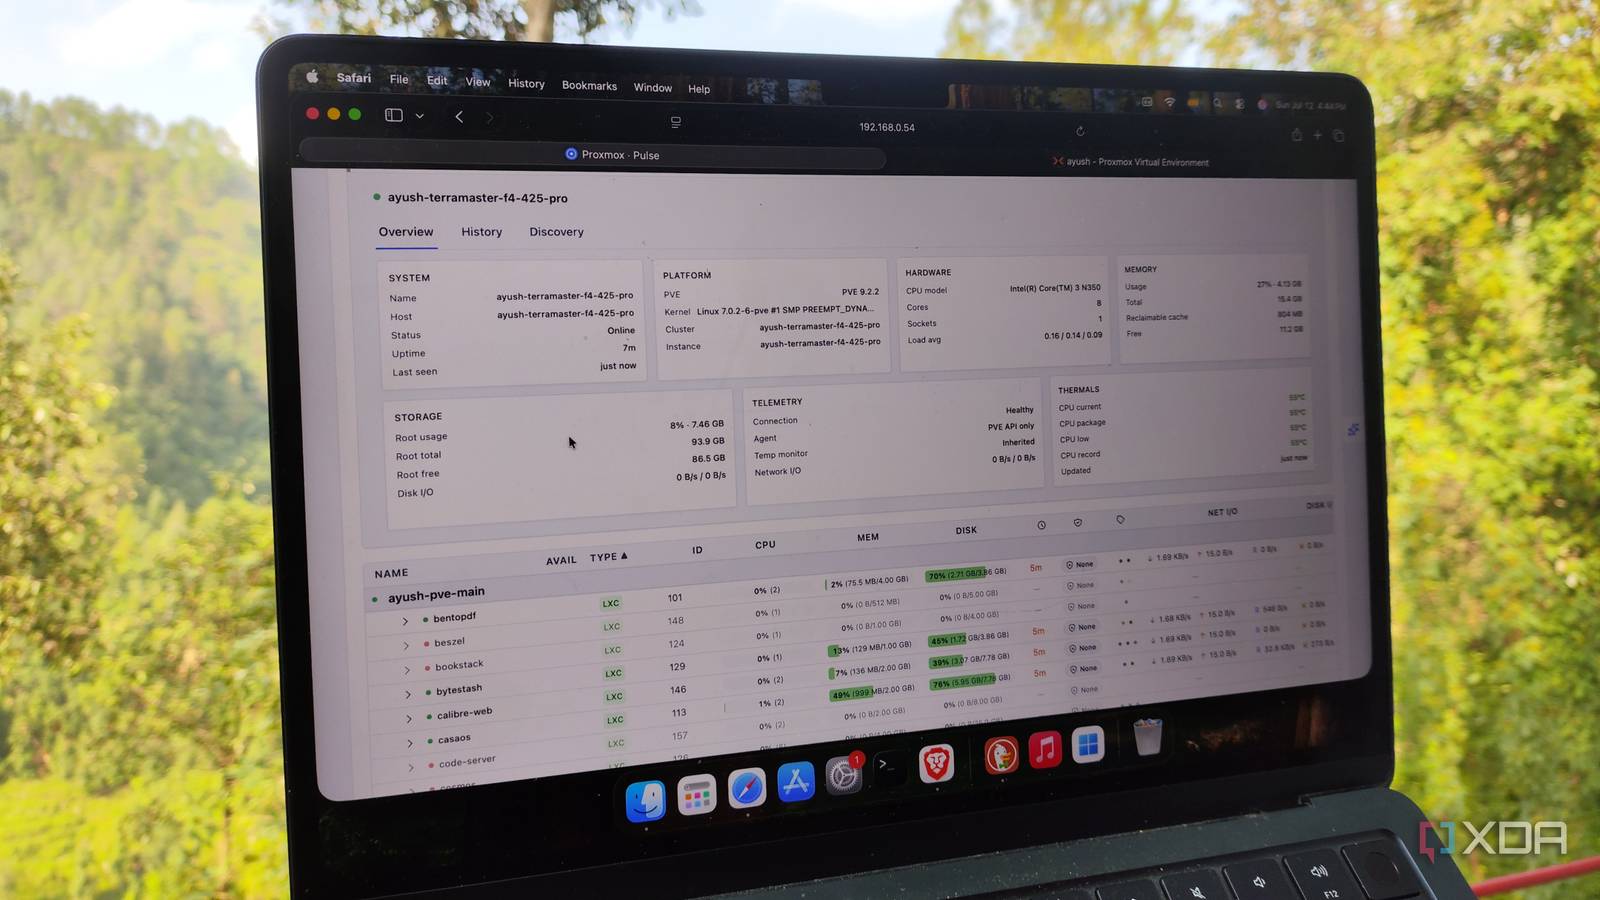
Published Oct 4, 2026, 2:00 PM EDT Ayush Pande is a PC hardware and gaming writer. When he's not working on a new article, you can find him with his head stuck inside a PC or tinkering with a server operating system. Besides computing, his interests include spending hours in long RPGs, yelling at his friends in co-op games, and practicing guitar. Since I’ve got dozens of services deployed across my workstations, I had to create a FOSS stack comprising applications whose sole task is to ensure my containers, virtual machines, and underlying hosts chug along without any issues. Authentik, for example, lends iDP functionality to all the web UIs in my arsenal that support SSO authentication, while Gotify acts as my primary alert server. For the longest time, Uptime Kuma used to be an important part of this stack. However, it could only keep an eye on my containers and monitor their uptime, and I had to install yet another app called Beszel to check the host machine stats. Fortunately, I ran into Pulse a while ago, and this all-in-one monitoring tool replaced both Uptime Kuma and Beszel. Better yet, Pulse can also connect to local LLMs and use their superior reasoning capabilities to identify problems that the average uptime monitor couldn’t detect. Even without LLMs, Pulse can keep tabs on all my server nodes And this includes non-Proxmox workstations When I first deployed Pulse, I did so because I’d heard it meshes well with Proxmox servers. And that turned out to be a huge understatement. For starters, Pulse can pull the CPU, memory, storage, network, and uptime metrics of all the virtual guests on my Proxmox workstations without requiring me to manually feed their IP addresses and credentials to its web UI. Rather, it pulls all the information directly from the underlying Proxmox node once I paired the two together. Plus, it’s also capable of tracking the resource stats, temperature metrics, logs, and hardware specifications of the PVE host – and it can do so for every standalone and cluster system in my arsenal. Heck, its monitoring provisions well with other platforms besides Proxmox Virtual Environment. I’ve got a Proxmox Backup Server that receives snapshots of essential virtual guests from my PVE nodes, and Pulse provides a dedicated section where I can view the snapshot history of my LXCs and VMs. Likewise, it’s compatible with TrueNAS and can pull the storage pools, datasets, and replication metrics from the king of ZFS NAS distros. I’ve also got some really old PCs serving as Ubuntu Server-powered Docker hosts for my containerization projects, and Pulse can even display their uptime and resource consumption stats. I don’t really use Proxmox Mail Gateway, VMware’s ESXi, or Unraid, but Pulse gets some brownie points for supporting these platforms. Since Pulse is compatible with Apprise and SMTP notifications, it can even dish out alerts if my virtual guests or host machines go offline. There’s also the Pulse Patrol, which runs automated scans on all my nodes to check for resource issues. I can also freely modify the alert thresholds of my nodes and virtual guests, so the scheduled checks don’t report false positives. I’ve got the free version of Pulse Patrol, and although it adds a 1-hour cooldown period between successive scans, 24 scans per day isn’t too bad. It supports plenty of LLM providers, too Another neat aspect of Pulse is the built-in Assistant, which exposes my home lab nodes to AI models and provides them all tools to scan, query, and fix problems affecting my servers. Since the LLMs can access the server metrics captured by Pulse, the chances of them sprouting hallucinated information go down a notch, even more so when I toss bulkier models into the mix. As for the AI providers, Pulse supports all the big names in the LLM space. But since I don’t want random companies gaining access to my server stats, I added the IP address of my llama.cpp server under the OpenAI provider and used it to connect my local models to Pulse. Models-wise, I decided to go with a Qwen3.6-35B-A3B instance running on my RTX 3080 Ti via MoE offloading whenever I need precise answers about broken workstations. But Gemma 4 E4B running on a GTX 1080 works pretty well when I just want to run simple queries. Personally, I tend to use Pulse Assistant to grab specific resource stats from multiple nodes for the most part. But when things do go wrong with my setup, I’d often consult my LLMs about the problem. Of course, I’d never let them run any commands automatically, but it’s worth noting that Pulse includes the option to run automatic fixes. It also ships with an MCP adapter that lets you pair Claude and other external apps, which makes it really handy for folks who want to add extra context to their agents’ queries. Pulse
I paired this Uptime Kuma killer with local LLMs, and monitoring my Proxmox servers has never been easier
Full Article
Original Source
Read the full article at Xda-developers →KhanList aggregates and links to publicly available news content. We do not host full articles from third-party sources. Always verify important information with original sources.