
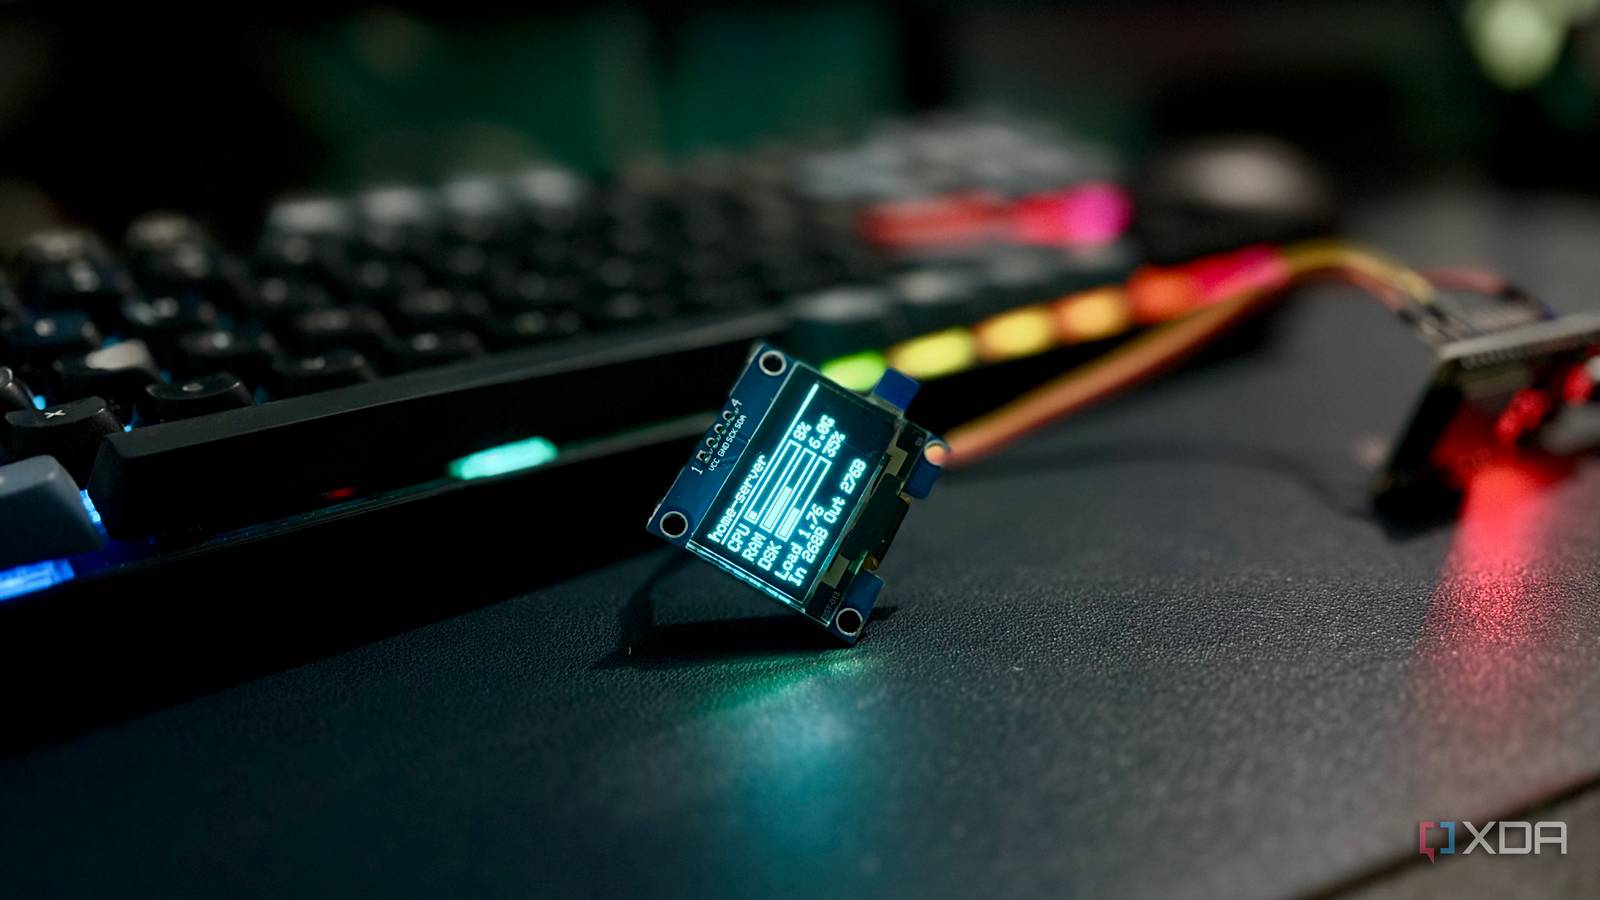
Published Oct 14, 2026, 10:00 AM EDT Shekhar Vaidya is a veteran technology journalist and computer science engineer. He is the founder of TechLatest, where he has spent years providing technical analysis on hardware and Windows ecosystems. Now a Computing Writer at XDA, Shekhar leverages his deep background in NAS, storage solutions, and PC internals to help readers master their tech. My home Debian server runs on a repurposed Dell Latitude laptop and hosts more than 20 self-hosted services. Soon after building the server, I learned about the importance of monitoring. I always have multiple monitoring and management tools inside and outside the server, like Pulse, Beszel, and Komodo. But they all have one gap: I have to open a dashboard or an app (ntfy) on my phone to check my server status. So I started looking for a way to see the server without opening anything. Luckily for me, I have been into microcontrollers for the last few weeks. And a $5 ESP32 is my go-to board for small IoT projects. I decided to use the ESP32 and a cheap OLED display to build a screen that shows live stats from the server. Rich or fresh? The first important thing was to figure out the datapath. Some monitoring services run on the same server, like Pulse and Uptime Kuma, and some run externally to cover blind spots, like Beszel and Komodo. I always say a monitoring service shouldn't run on the server it monitors. I had both setups because the services I was still testing stayed on the home server, while the ones I actually rely on to monitor it live on a remote VPS. I was clear that I'd use either Beszel or Komodo for the data. But choosing the perfect one for this task was tricky. Both exposed server stats, but each came with a few asterisks. Komodo used a simple API key and secret pair to fetch the data, whereas Beszel needed my login credentials to authenticate the request and generate a temporary token. So, for Beszel, I would have to program the sketch to handle token expiry and re-login. That was the auth part; now, on the data side, Beszel exposed more than Komodo, like per-core CPU and per-interface network figures, plus battery stats (in my case). Komodo exposed fewer details, like CPU, RAM, disk, load, and network. Komodo refreshed stats every 5 seconds, while Beszel refreshed them every 60 seconds. In the end, it was data richness vs. freshness. So, I compromised on richness and chose freshness because that was the whole point of a monitoring system that would live on my desk. My serial monitor said everything was fine, and the screen disagreed One of them had to be wrong I thought, since the datapath part was done and I already had the hardware required to build this project, it would take a few minutes to an hour to build. But what happened next took me a few days instead of an hour. My go-to path to build an ESP project is simple: Arduino IDE, an ESP32, a data cable, and Claude Code. With the plan in place, I wrote the sketch in a few seconds. It took a couple of iterations to compile and flash the sketch to the ESP32. As mentioned earlier, I am fairly new to microcontrollers, so I am a little hazy on soldering and connecting the wires. For wiring, I always go slowly, and for soldering, I try to avoid it whenever possible. So, after the sketch was compiled, flashed, and ran successfully, the next step was to connect the display and see the result. I used four male-to-female jumper wires to connect the VDD, GND, SCK, and SDA pins from the display to the 3V3, GND, GPIO22 (labeled D22), and GPIO21 (labeled D21) pins on the ESP32, or what I thought I did. On the first attempt, nothing showed up. I recompiled and flashed again, but nothing happened. I disconnected the data cable from the PC and plugged it in again; still nothing. I was confused because the serial monitor showed me the stats, but the display was blank. I then wrote another sketch to test just the display; the result was “No I2C device found – check wiring.” That was when I checked the connections again. The board was hot, the display was warm, and I found out that I swapped the GND and VDD wires by mistake. The display labels GND first, and I might have wired by position. After multiple attempts, I couldn’t make that work; the display was most likely dead. Then I ordered a new display from Amazon. Finally, when it arrived, I made a few changes to the sketch, mainly because the new OLED was a 1.3-inch display that needed a different driver. I connected the wires again, but this time with extra caution. And after days of waiting, I could finally see my live server stats on a $10 display. It tells me when something’s off, but never what A glance, then a login So, what is it like to live with it? Well, it is nothing extraordinary, but now with just one glance at the display, I know how my server is doing. For context, the Dell is a business-grade laptop, but it was never meant to be a 24/7 server. It has a Core i5-6300U CPU paired with 12GB RAM and a 256GB SSD. The storage may look small, but I use my old NAS for bulk storage. Now, coming back to the point, the specifications aren’t enough for the services I host on it. Even a couple of Jellyfin transcodes can spike the CPU, or a few large Stirling PDF operations can tank the memory, and the display keeps those details front and center — CPU, RAM, load, and network. This is not a replacement for my monitoring services, because after noticing something strange on it, I will visit either a monitoring dashboard or the server to see what's wrong. This is not a perfect project; there are a few trade-offs. First, since Komodo is hosted on a remote VPS, the ESP display always needs internet to work. Second, the API key and secret sit in plain text on the device, and I generated that key-secret pair from my superadmin account, which technically has full access to all my servers. Third, I gave up more detailed stats and temperature readings by choosing Komodo over Beszel. But for me, those tradeoffs were worth it. My homelab finally has a face After building this project, it felt like another precautionary step toward my homelab’s monitoring system. And it is almost a complete loop. I glance at the display; if I notice something odd, I investigate it further. It also complements my last ESP32 project, where I built a watchdog for my server. The real takeaway from this project is that a cheap microcontroller can be a useful face for a homelab without replacing the monitoring tool or becoming another one. Brand AITRIP Connectivity Features UART, USB The ESP32 is a fantastic development board that combines solid specs with an affordable price. Despite being cheaper than Arduino and Raspberry Pi Pico, it outperforms most of its rivals. Plus, the ESP32 even has Wi-Fi and Bluetooth functionality built into every board, making it great for projects where you can't physically keep the microcontroller connected to your PC at all times.
I built a $15 ESP32 display that shows exactly what my home server is doing
Full Article
Original Source
Read the full article at Xda-developers →KhanList aggregates and links to publicly available news content. We do not host full articles from third-party sources. Always verify important information with original sources.