
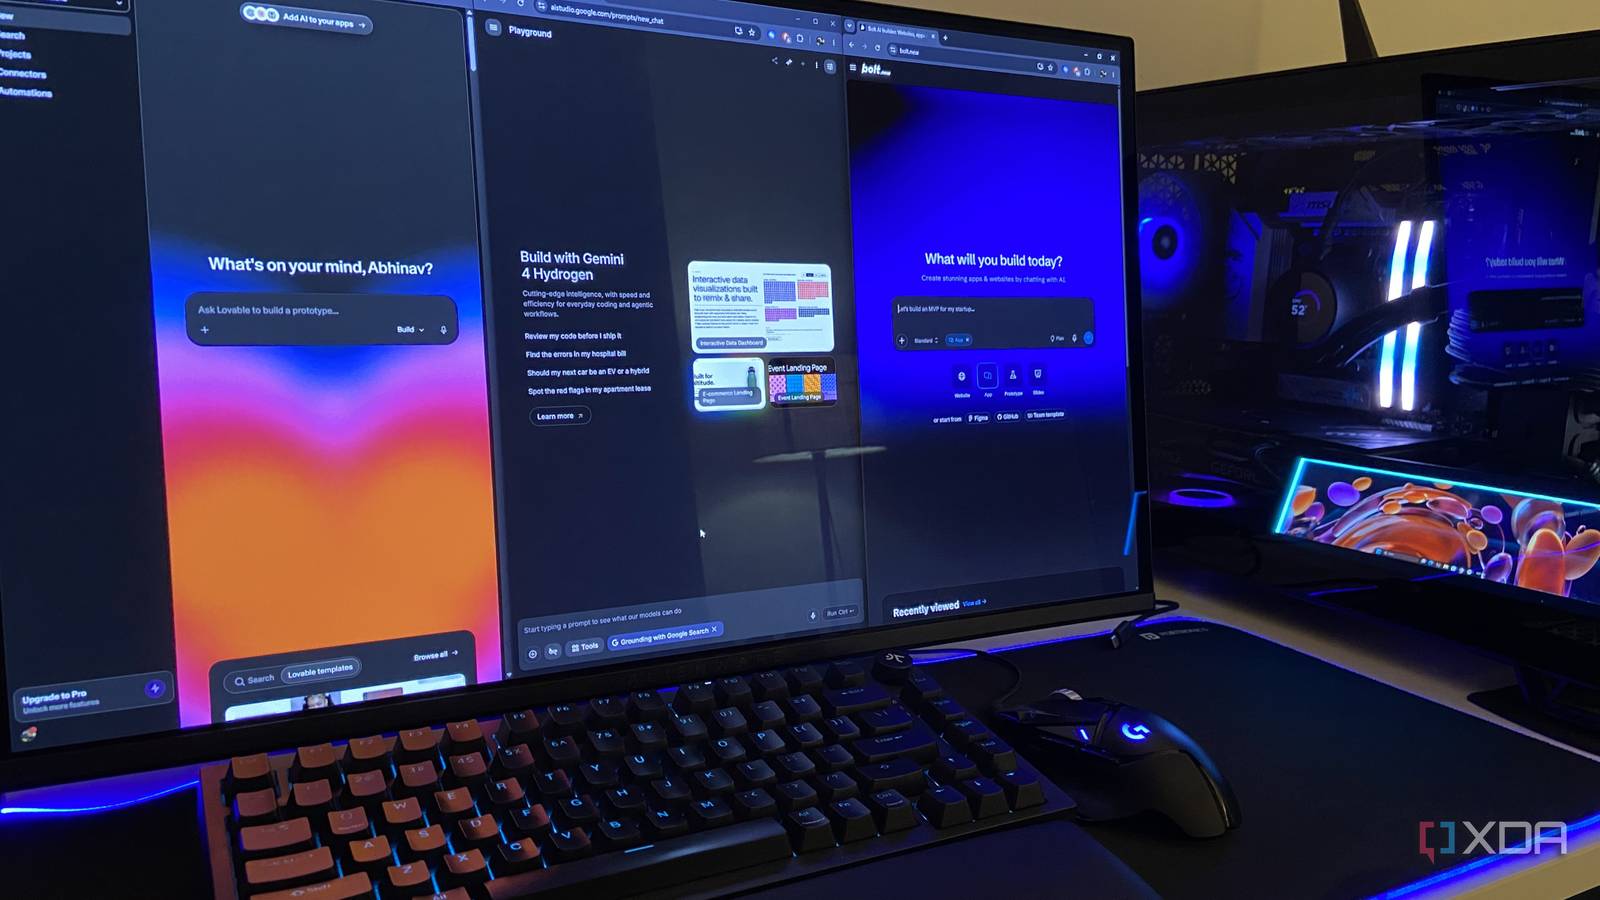
Published Nov 17, 2026, 12:30 PM EST Abhinav pivoted from a career in banking to pursue his first love in writing. Even while working full-time, he continued contributing as an editor-at-large, a role he has held for more than 7 years. A lifelong tech enthusiast who has built three gaming and productivity powerhouse PCs since 2018, his passion for technology keeps him closely following the semiconductor industry, from NVIDIA and AMD to ARM. His MSc dissertation explored how artificial intelligence will reshape the future of work, reflecting his curiosity about the wider social impact of emerging technologies. If you have the vision of an application, and the words to describe it, there are many no-code AI services that can deliver it to you with just a prompt. Three of those apps that have gotten increasingly popular amongst vibe coders and developers alike include Google AI Studio, Lovable, and Bolt, and almost every single one of them has something the other two can't match. What truly takes any of the apps they make from functional to usable, however, is the condition that they're able to solve a persistent problem for the user. As someone who frequently tests and benchmarks applications on a variety of SKUs for a living, I wanted an application that reads my data and tells me in plain language how smooth a given run was, and what frame cap to set. With nothing but the vision of this app, I fed the same prompt to the three AI-powered web developers. I wrote one prompt, with two captures, and made no attempts at fine-tuning Written in the way benchmarkers talk Curious to see how the three would cope with a request phrased the way benchmarkers talk, I kept every bit of jargon in the prompt and explained none of it to see whether the models underneath could deliver with zero hand-holding: I want a web app for checking my game benchmark runs. I'll upload a CSV frametime capture from CapFrameX or PresentMon, and it should tell me in plain English how smooth the run was. Show me the average FPS and 1% low, how many frames took longer than 50 ms and when in the run they happened, and a frametime graph with those frames marked. At the end, tell me what the frame rate cap to set for the game, meaning the highest frame rate my PC held for 99% of the run. I had decided to add no fix prompts, no hand edits, and the same two captures for every app, which was a minute of Star Wars Jedi Survivor at max settings, followed by a shorter second run. Bolt got the numbers right, but the story wrong There's a graph here, you just can't read it Bolt's UI was the plainest of the three, but that isn't something I'd ever find myself complaining about. When it came to the core functionality, Bolt delivered perfectly on the arithmetic. My Jedi Survivor run came back at 118.1 FPS on average, a 26.2 FPS 1% low, six frames over 50 ms with accurate timestamps, and a 75 FPS cap recommendation, while the second run received a correct 57 FPS cap as well. The interpretation, however, was erroneous. Jedi Survivor froze for 1.27 seconds at the start of the run, and Bolt scaled its entire graph around that single frame, which flattens the remaining minute into a line along the floor. Its verdict then described both runs as choppy and riddled with frequent hitches, even though four of the six slow frames came within the first two seconds. I then took a magnifying glass to the code and found the reason for this. Bolt prints that same sentence whenever 1% low falls below 60% of the average as a rule, regardless of when the hitches happened, or how many were there. This means that, as a user, I can't trust the verdict. A run that stuttered once while loading gets the same "choppy" label as the one that hitched throughout, and that's notoriously misleading while going through many of these at the same time. Google AI Studio worked the hardest, but... Then told me to cap at... 0 FPS? Google AI Studio with the new Gemini 4 Hydrogen was carrying some heavy expectations, especially given how relentless Google has been when it comes to marketing the model everywhere. In all fairness, it did build the most out of all others within a span of 4 minutes and 51 seconds, and the UI is the most pleasing to the eyes to the point that I thought I had a winner when I opened it. The graph opens on a 0-65 ms focus view with a full scale toggle, drag-to-zoom, and a cap line. A stutter log jumps to each hitch in one click, a table shows how much of the run every cap from 30 to 120 FPS would hold, and you can also download the whole thing as a .txt report. Its main recommendation matched the others, which was exactly 75 FPS for Jedi Survivor's first run, and 57 FPS for the second run. The trouble was within an amber note right below it, which told me that if I still noticed dips at 75 FPS, I should step down to 0 FPS. Thinking it was possibly an error, I tried the second capture, and it told me to step down to 1 FPS instead. While the main cap was right both times, at 0 or 1 FPS, Gemini 4 Hydrogen wanted me to just give up and run the game through PowerPoint instead. Lovable is in a league of its own It read my data the way a benchmarker would Lovable was the fastest to finish its app, and yet it is the only one of the three I'd open again. If I dropped in a capture, I'd see the numbers pop out. The recommendation was the same as the other two apps, which was about 75 FPS for Jedi Survivor's first run and 57 FPS for the second, along with the same caps the others had recommended. The key differentiator was what it does with those numbers. All three flagged the run as choppy, but Bolt stopped at the label, and AI Studio noticed the hitches came early and yet still blamed the heavier scenes. Lovable, on the other hand, told me exactly why my run stuttered. It noticed that the hitches were bunched up at the start, attributed them to loading or shader compilation, and stopped there without overanalyzing. In addition, it also told me where to set the frame cap, recommending either the in-game limiter or RTSS, so that the frame rate remained level instead of bouncing around. It didn't generalize the whole run for a few seconds of loading, and that's exactly the kind of call I'd be looking for when looking through half a dozen graphs myself. This, also, is the kind of thing that would save me hours of second guessing the setup, variance, and an endless number of other factors that influence the run. Lovable wins, but AI Studio has enormous potential Before jumping into this test, I expected Google AI Studio to pull ahead with Gemini 4 Hydrogen behind it, and in many ways, it did. Its UI is undoubtedly the most polished of the three, and the zoomable graphs are genuinely useful to anyone delving into data analysis. However, a single technical flaw matters a lot when every app gets one shot with zero fixes. Lovable pulled ahead by getting everything right on the first try, and the insights that it produced showed signs of it being context-aware. That said, if you're willing to fine-tune afterward, I'd say that AI Studio is showing a lot of untapped potential.
I asked Lovable, Bolt, and Google AI Studio to build the same web app, and one is in a different league
Full Article
Original Source
Read the full article at Xda-developers →KhanList aggregates and links to publicly available news content. We do not host full articles from third-party sources. Always verify important information with original sources.