
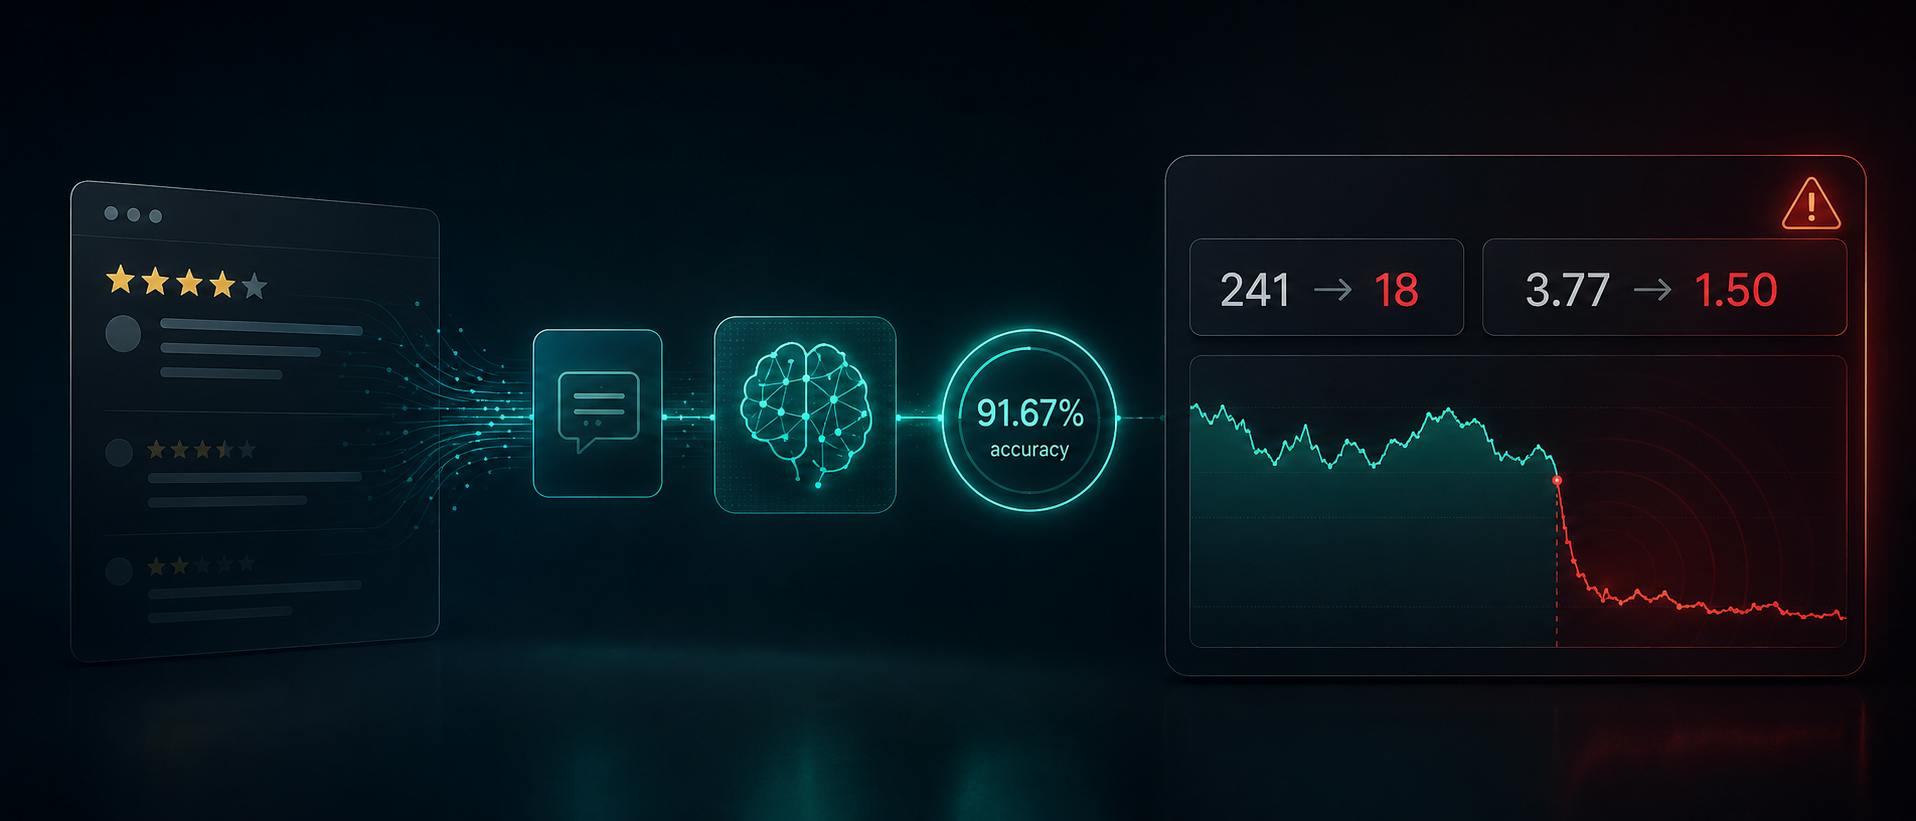
Before this became a nightly product, competitor-review analysis started with a screenshot.Someone would take the first visible page of public reviews, pass it to ChatGPT, and stretch the result with an estimate of monthly review volume. It was fast. It was also a little too convincing.The number looked precise. The method was not.Customer Care and the CRO wanted a simple thing: keep track of competitors. In practice, that meant answering a messier set of questions. Which companies? Which markets? How often? What labels? What would count as a real signal?None of that was obvious at the start. We began with roughly five companies in two markets. The production workflow now covers fourteen companies, including our Company, across three markets. It runs every night and is still in use.From one review at a time to a nightly workflowThe project did not start with fine-tuning. We used prompting.It took about a week to get the first stable prompt. The hard part was not making the model sound smart. The hard part was making the output dull enough for another process to parse every night.Each review got one sentiment label. It could also receive up to five category labels. Categories were stored as pipe-separated values. A cleaner structure would have looked nicer. This one fit the workflow we already had.The first model provider was OpenAI, but we kept the provider call replaceable. The rest of the product did not need to know which model sat behind that step.Our first processing design was too literal: one review, one request.That survived a small test. At a larger scale, it ran into timeouts, rate limits, request limits, and memory pressure. After testing batches, we settled on twenty reviews per request. In our environment, that was the stable point. We classified reviews in their original language. No translation step came first.The taxonomy stayed the same across the European markets in scope. An early manual spot check returned ten correct classifications out of ten. Useful, yes. Proof of multilingual quality, no.The workflow itself also needed work. At first, too many steps lived in one large flow. A small change near the start could affect something much later. Splitting the job into smaller subflows made it easier to support. Reliability improved without changing the model.What the 300-review evaluation showedAt some point, "seems to work" was not good enough. We evaluated the classifier on a stratified proportional sample of 300 reviews across the active domains. Before the run, we set an 85% acceptance threshold for overall sentiment accuracy.The classifier reached 91.67%. In plain numbers, 275 of 300 sentiment labels matched the reference labels. That was a pass. It was not the full answer.The class-level view mattered more.Sentiment results Sentiment Precision Recall F1 Support Positive 0.93 0.99 0.96 187 Negative 0.97 0.88 0.92 80 Neutral 0.68 0.58 0.62 33 Macro average 0.86 0.82 0.84 300 Weighted average 0.91 0.92 0.91 300 Positive and negative reviews were easier.Neutral was where the model struggled. It recalled only 19 of 33 neutral examples, and the neutral F1 score was 0.62. Short, mixed, or restrained reviews did not behave like obvious praise or obvious complaints.That gap matters once the labels reach a dashboard. If neutral movement is pushed toward positive or negative, the market can look more dramatic than it really is.Category resultsThe report also measured the five most frequent categories in the sample. Category Precision Recall F1 Support FastProcessingDelivery 0.90 0.87 0.88 83 DeliveryIssues 0.92 0.86 0.89 42 Other 0.58 0.91 0.71 35 GoodCustomerService 1.00 0.61 0.76 28 ProductQualityComplaints 1.00 0.50 0.67 22 Micro average 0.83 0.80 0.82 210 Macro average 0.88 0.75 0.78 210 Delivery labels held up comparatively well.Other was less tidy. Its recall was 0.91, but precision was only 0.58. It caught many reviews that did not fit elsewhere. It also swallowed reviews that should have gone into more specific buckets.ProductQualityComplaints had the reverse problem. Precision was 1.00 in this sample, but recall was only 0.50.When the model used the label, it was right. It just missed half of the reference examples.The error file made the headline score look less complete. Disagreement type Count Share of 300 Wrong category only 50 16.7% Wrong sentiment only 16 5.3% Both sentiment and category 8 2.7% Suspected sarcasm 1 0.3% At least one disagreement 75 25.0% Seventy-five rows had at least one disagreement. Some were clear mistakes. Others were more awkward than that.One review said:Great price with great customer service.The reference category was FastProcessingDelivery. The model returned GoodPrices and GoodCustomerService.Another review was only two words:Qualité, RapiditéThe reference category was DeliveryIssues. The model returned FastProcessingDelivery and QualityOfProducts.Neither reference label was easy to defend as the only acceptable answer.Our production classifier was multi-label. A review could contain several themes. A single-category comparison row could turn a reasonable extra label into an error.So the evaluation was not only testing the model. It was also testing the taxonomy and the reference labels. That was useful, even if it was uncomfortable. It showed where prompt work stopped being the obvious fix.The report pointed to the categories that needed the most refinement:CategoryMisclassifications recordedOther22FastProcessingDelivery8GoodPrices6CompatibilityIssues6QualityOfProducts3The recommended next step was to add disambiguation examples and rerun the evaluation.Our production change was smaller. We lowered temperature from 0.5 to 0.3.Because the headline score had already cleared the agreed threshold, the bigger taxonomy revision was easy to postpone. That is one danger of a good number. It can make unfinished work feel less urgent.The chart that looked brokenThe most useful production incident began with two dashboard numbers.For one company, monthly review volume moved from 241 to 18. That was a 92.5% drop. The average rating moved too, from 3.77 to 1.50. A fall of 2.27 stars.Our first thought was not "market event." It was "the pipeline broke."That was a reasonable suspicion. A source can change. A workflow can miss a page. A filter can become too strict. Aggregates can be wrong for boring reasons.We checked the public source manually with the project stakeholder. The same pattern was visible there. The dashboard had not invented the movement. The pipeline had not quietly lost a large block of reviews.That check answered one question and left the harder one open. The public review signal had changed. We could confirm that much. We could not explain why from review data alone. Maybe the company changed how it asked customers to leave reviews. Maybe business activity dropped. Maybe another operational change moved both volume and rating.Review data did not prove a change in orders, revenue, or market share. The distinction mattered. The signal was escalated, but we did not track the later commercial action. So there is no downstream ROI claim here.This is where 91.67% stopped being useful.It measured agreement between model labels and a reference set. It did not tell us whether the source had changed, whether the input was complete, or what an unusual aggregate meant for the business.The taxonomy did not grow fast enoughOur main discovery mistake was taking the first requirements too literally.The first schema reflected the metrics named in the brief. Once more reviews moved through the system, other useful themes started appearing. We had not created fields for them. The text contained more information than the taxonomy could store.That is a quiet failure mode. The pipeline can run cleanly. The model can be consistent. The dashboard can still discard a signal because no field exists for it.We would handle that differently now. Before locking the taxonomy, we would read a broader sample and map the recurring information in the reviews. Not only the categories stakeholders named at the start.We would also evaluate by language and market. A pooled sample plus a ten-review multilingual spot check was not enough for that claim.The reference set needs the same care.When a model output fits the text better than the human row, prompt tuning is not automatically the right response. The category definition, the annotation rule, or the label itself may need to change.Where the system stands nowThe product moved from a screenshot-based estimate covering about five companies in two markets to a nightly workflow covering fourteen companies across three markets.The formal benchmark contains 300 reviews. Sentiment accuracy is 91.67%. F1 scores range from 0.96 for Positive to 0.62 for Neutral. The top category F1 scores range from 0.89 for DeliveryIssues to 0.67 for ProductQualityComplaints.The error review contains 75 disagreement cases. Category-only mismatches account for 50 of them. Those numbers are useful because they show the limits of the system.They do not explain a 92.5% collapse in public review volume. They do not turn a public review signal into a causal business conclusion.The next work is clear enough: tighten the weakest category boundaries, re-check the reference labels, rerun the evaluation after prompt changes, and measure performance by language and market.For us, that is more useful than chasing a slightly higher accuracy number while leaving the product unable to say what its own signals mean.Author's note: This article was written by members of AUTODOC's Innovation & AI Team about an internal product for analyzing publicly available customer feedback across selected companies and markets. We have omitted collection mechanics and the identity of the company in the anomaly example. Public reviews are directional signals, not proof of sales, market share, or causality. The views expressed are our own.
How We Built an LLM Review Pipeline and Why 91.67% Accuracy Wasn’t Enough
Full Article
Original Source
Read the full article at Hackernoon →KhanList aggregates and links to publicly available news content. We do not host full articles from third-party sources. Always verify important information with original sources.