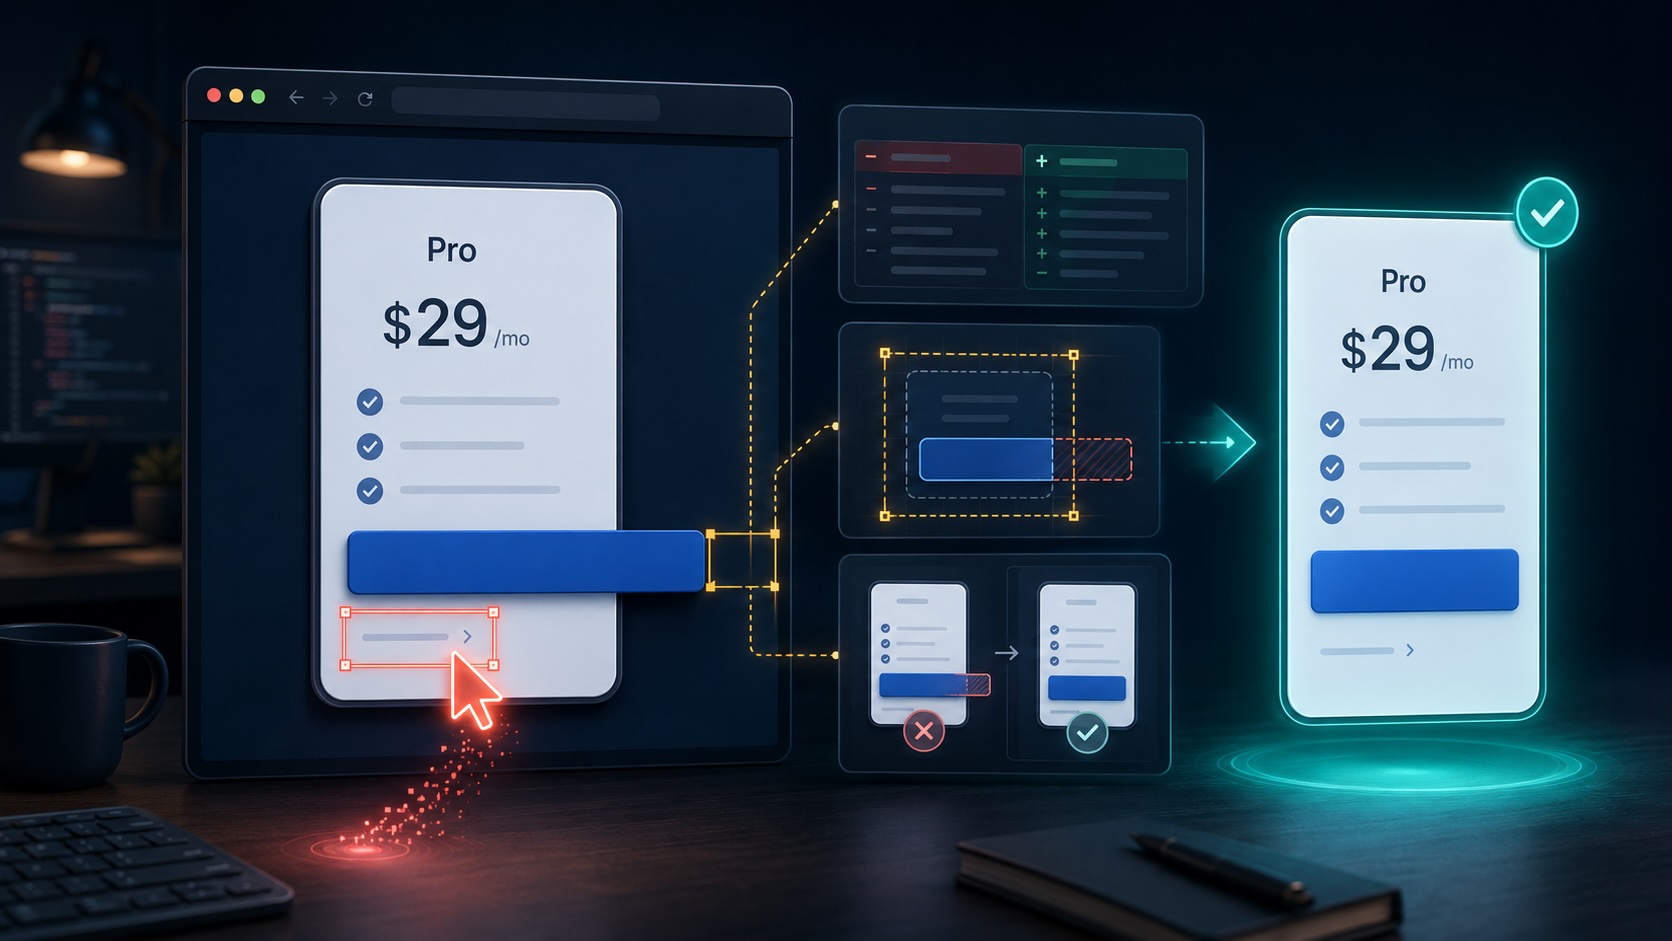
agent a request, the hard part is not always writing code. The hard part is showing that the agent understood the request, changed the right place, and verified the right result. An agent can do several things during a run and still end with a short answer like “fixed.” That answer hides the important details: what it inspected, what it changed, what it ran, and what proved the fix worked. Without evidence, you cannot tell whether the final check matched the user’s original complaint. That gap shows up in ordinary coding requests. A passing build can show the app still compiles, even though the button is still broken. A passing test can mean the assertion got weaker. A plausible route change can still miss the handler that serves the response. A coding agent should change code and prove what it inspected, what it changed, what it ran, and what result made the fix acceptable. Software engineering already has a name for part of this problem: traceability. Torkar et al. describe requirements traceability as the ability to follow a requirement from its emergence to its fulfillment. In coding agent work, the same idea becomes more immediate: can you connect the user’s request to the files inspected, the patch applied, the command result, and the final verification check? Model Context Protocol (MCP) describes a standard way for artificial intelligence applications to connect to files, tools, data sources, and other external systems. That standard only helps if the tool run leaves evidence a developer can review. The tutorial tackles a problem both developers and vibe coders run into: the agent changes something, sounds confident, and leaves you guessing whether it touched the right part of the app. The example uses a user interface bug because visual fixes are easy to get wrong and easy to verify in a browser. A pricing card has a primary button that overflows on a mobile screen size. The repair is a targeted Cascading Style Sheets (CSS) change. The useful part is the saved evidence around the repair: file reads, a wrong selector attempt caught by the browser check, a targeted patch, build output, Document Object Model (DOM) measurements, and before and after screenshots. By the end, you should have a review pattern you can adapt to common coding-agent failures: the wrong file, the wrong selector, the wrong function, a skipped command, an edited test, a broken route, a missed edge case, or a fix that passes one check but fails the user’s actual request. The developer problem is broader than UI Here is the kind of request many developers now give to Codex, Claude Code, Cursor, or another coding agent: Fix the button in the pricing card. It overflows on mobile. That prompt sounds clear to a human. It is not enough evidence for an agent. The same review problem appears outside user interface work: “Fix the checkout bug” can change the wrong payment branch.The agent might edit the PayPal flow when the bug is actually in the Stripe flow, or patch guest checkout when the failure is in logged in checkout. “Make this test pass” can weaken the assertion instead of fixing the behavior.Instead of fixing the broken code, the agent might change the test so it checks less. The test passes, but the real bug remains. “Update the API response” can edit a type but miss the handler.The agent might update a TypeScript type or schema, but forget to change the backend function that actually returns the response. “Fix auth redirect” can patch the frontend while the backend still returns the wrong status.The agent might change React routing, but the real issue is the server returning 401 instead of 302, or missing a session cookie. “Clean up this function” can change behavior while looking like a refactor.A refactor should preserve behavior. The agent might rename, reorder, or simplify code in a way that changes what the function does. The question is the same in each case: what did the model ask to do, what code actually changed, and what check proved the user’s complaint was fixed? The agent still has to answer several questions: Which file owns the pricing card? Which selector is the target? Is the problem caused by the card, the grid, or the button? What does “mobile” mean for this check? Did the rendered UI change, or did only the code change? The UI example keeps those questions visible because the browser can measure the failure. For the public version, put the broken app and agent script in a companion repository. I use this repository name in the commands below: coding-agent-run-recorder The target HTML is a pricing card: Starter Launch plan $19 per month A focused plan for solo builders shipping client portals and internal tools. Start your workspace today Talk to sales The broken CSS is the real bug: .primary-action { width: 360px; padding: 0 28px; color: #ffffff; background: #111827; white-space: nowrap; } At a 390 x 844 browser size, the card is 354px wide. The button is 360px wide before padding and sits inside a padded card, so it extends past the right edge. Screenshot by author. The primary button extends past the right edge of the starter pricing card at the same mobile browser size used in the browser check. What the agent needs to prove A useful coding agent run should answer five questions: What files did the agent inspect? What selector or component did it identify as the target? What exact patch did it apply? Did the app still build? Did the right check prove the reported problem changed? This is stricter than asking for a diff. A diff is the before and after view of a code change. It can look reasonable even when the page is still wrong. A screenshot can show the target button fixed while hiding that another component broke. A passing build only proves the app compiled. It does not prove the user interface still looks right. For coding agent work, the final answer should be a summary of evidence, not a claim of success. The tool setup The Python script wraps the model’s tool loop with a recorder. The model can ask for a tool. Python decides whether that tool exists, runs the matching function, and saves both the request and the result in the run log. That wrapper is the useful idea. If you want to know what your model did during a coding task, record the model’s tool requests and the real function results around it. The script gives the model the same kind of narrow tools you would expose through an MCP server: ToolWhat it doesWhy it existslist_filesLists relevant app filesPrevents blind editsread_fileReads one file at a timeMakes inspected context visibleapply_patchApplies a focused CSS patchKeeps changes reviewablerun_buildRuns npm run buildCatches broken app structureinspect_domOpens the app in Chromium and measures the targetVerifies the rendered elementcapture_screenshotSaves the browser screenshotGives visual evidence MCP matters here because it can package these tool functions for different agent clients. The core idea is still practical: the model requests a tool, the application validates and runs it, and the run log records both the request and the result. Whether the tools live in a Python script, an MCP server, or a larger agent framework, the review standard stays the same. Existing tools do part of this The point is not that agent observability is unsolved. Several tools already trace model calls, tool calls, costs, latency, and errors. Weights & Biases Weave tracks LLM calls, document retrieval, and agent steps. LangSmith gives visibility into traces and production metrics for LLM applications. Arize Phoenix records model calls, retrieval, tool use, and custom logic. Langfuse captures LLM calls and non-LLM calls, including tool calls, API calls, retrieval, embeddings, sessions, cost, and latency. There are also tools aimed more directly at coding agents. Dynatrace describes AI coding agent monitoring across LLM requests, tool executions, file snapshots, and diff operations. Arize has written about coding agent tracing across shell commands, file edits, command executions, datasets, and experiments. Those tools are useful once a team wants hosted traces, dashboards, search, cost tracking, or evaluation at scale. The gap here is narrower: how to wrap one model-driven coding task so a developer can see the exact tool requests, file changes, checks, screenshots when useful, and failures that led to the final fix. You can send this same run log to Weave, LangSmith, Phoenix, or Langfuse later. The first step is making sure the run records the right things. Run the tutorial The cleanest reader experience is the companion GitHub repository: abduldattijo/coding-agent-run-recorder. Colab can run this with extra setup, but a repository is a better default because the tutorial uses Node.js, Playwright, generated screenshots, and a static app. The repository should have this structure: coding-agent-run-recorder/ README.md ui_fixing_agent.py app/ index.html styles.css styles.before.css package.json scripts/ build-check.mjs inspect-ui.mjs media/ outputs/ Requirements: Python 3.10 or newer Node.js and npm Playwright’s Chromium browser, installed by the command below OPENAI_API_KEY for the model-driven run Use a project API key from your shell or Secret Manager. Do not paste the key into the script or commit it to the repository. After cloning or downloading the companion repository, install the Python package, Node dependency, and Chromium once: git clone https://github.com/abduldattijo/coding-agent-run-recorder.git cd coding-agent-run-recorder python3 -m pip install -r requirements.txt cd app npm install npx playwright install chromium Then run the evidence script from the companion repository root: cd .. python3 ui_fixing_agent.py --mode api If you want to regenerate the same browser evidence without an API key, use replay mode: python3 ui_fixing_agent.py --mode replay The run creates these files: outputs/before_dom_check.json outputs/wrong_selector_dom_check.json outputs/after_dom_check.json outputs/target_patch.diff outputs/build_output.txt outputs/ui_fixing_agent_run_log.json media/pricing-card-mobile-before.png media/pricing-card-mobile-wrong-selector.png media/pricing-card-mobile-after.png If you want a Colab version, use it as a secondary link with the repository cloned inside the notebook. The notebook should still run the same script and save the same files. I would not make Colab the only path because browser installs and saved screenshots are easier to inspect in a normal repository. The main path uses the OpenAI application programming interface (API), so the model chooses the next tool call. I used gpt-4.1-mini for the captured run shown here. Replay mode runs the same tool functions in the same order when you want to regenerate the evidence without using an API key. The important thing is that every claim comes from captured run evidence. The browser check The browser inspection uses Playwright locators and Playwright screenshots to open the page at 390 x 844, locate the target card and button, and compare bounding boxes. The core check is: const card = document.querySelector('[data-component="pricing-card"]'); const button = document.querySelector('[data-component="pricing-card"] .primary-action'); const cardBox = card.getBoundingClientRect(); const buttonBox = button.getBoundingClientRect(); const buttonInsideCard = buttonBox.left >= cardBox.left && buttonBox.top >= cardBox.top && buttonBox.right [email protected] build > node scripts/build-check.mjs Build check passed Copied 2 files to dist/ Evidence after the fix The final browser check passes: { "label": "after_fix", "viewport": { "width": 390, "height": 844 }, "selector": "[data-component=\"pricing-card\"] .primary-action", "cardBox": { "x": 18, "width": 354, "right": 372 }, "buttonBox": { "x": 41, "width": 308, "right": 349 }, "buttonInsideCard": true, "overflowRightPx": 0, "computed": { "width": "308px", "whiteSpace": "normal", "overflowWrap": "anywhere", "maxWidth": "100%" } } The target measurement changed from overflowRightPx: 29 to overflowRightPx: 0. Screenshot by author. The same starter pricing card now keeps the primary button inside the card boundary at 390 x 844. The final screenshot is useful, but the measurement is what makes the result easy to review. If a reviewer disagrees with the design choice, they can still see that the specific overflow bug was fixed. What the run log shows The full run log is saved in: outputs/ui_fixing_agent_run_log.json It records the complete chain: model requested restore_baseline restore_baseline model requested list_files list_files model requested read_file read_file index.html model requested read_file read_file styles.css model requested inspect_dom inspect_dom before_fix model requested apply_patch apply_patch wrong selector model requested inspect_dom inspect_dom wrong_selector_attempt model requested apply_patch apply_patch target button model requested run_build run_build model requested inspect_dom inspect_dom after_fix That is the part many agent runs miss. Without the run log, the developer only sees the final code. With the run log, the developer can inspect the model’s requested actions and the function results that followed. If the agent read the wrong file, the run log exposes it. If it changed a global selector, the patch exposes it. If it skipped the browser check, the missing file exposes it. If the browser check still failed, the final JSON exposes it. How to adapt this to your own agent The pricing card is only the example. The reusable pattern is: vague coding request read the likely files identify the target behavior run the check that shows the broken state apply a narrow patch run the build run the same check again save the run log, diff, JSON, and screenshots First, change the tools. Keep read_file, apply_patch, and run_build, but replace inspect_dom with the check that matches your bug. For an API bug, that might be call_endpoint. For a test failure, it might be run_test. For a database change, it might be run_migration_check. Second, change the proof. The proof should match the original request. If the user asked about a button, use a browser measurement. If they asked about checkout, use the payment branch or response body. If they asked about a failing test, keep the original assertion and show the fixed test output. Third, keep the run log. The useful record is always the same: model tool request, function arguments, function result, patch, command output, and final check. This pattern works beyond user interface work. An API bug might compare status codes and response bodies. A database change might run a migration check. A refactor might run behavior tests before and after the patch. The check changes, but the review record stays the same. The point is not this pricing card. The point is to stop accepting “fixed” without evidence. Sources Playwright documentation: Browser automation, locators, screenshots, and viewport checks. Model Context Protocol documentation: Tool boundaries and server/client packaging for agent-accessible tools. OpenAI function calling and tools documentation: Tool schema and tool-call loop concepts. OpenAI Agents SDK documentation: Agent/tool orchestration patterns for production systems. Weights & Biases Weave documentation: Existing observability and evaluation for agents and LLM applications. LangSmith observability documentation: Existing hosted tracing and observability for LLM applications. Arize Phoenix documentation: Existing tracing for model calls, retrieval, tool use, and custom logic. Langfuse documentation: Existing tracing for LLM calls, tool calls, retrieval, cost, latency, and sessions. Dynatrace AI coding agent monitoring: Existing monitoring for coding agent traces, tool executions, file snapshots, and diff operations. Arize coding agent tracing: Existing tracing and evaluation workflow for coding agent runs. R. Torkar et al., “Requirements Traceability: A Systematic Review and Industry Case Study,” International Journal of Software Engineering and Knowledge Engineering, 2012: Software engineering background on tracing a requirement from origin to fulfillment. coding-agent-run-recorder companion repository: Complete runnable code, generated outputs, screenshots, and run log for this article.
How to Debug AI Coding Agents When They Change the Wrong Thing
Full Article
Original Source
Read the full article at Towardsdatascience →KhanList aggregates and links to publicly available news content. We do not host full articles from third-party sources. Always verify important information with original sources.