
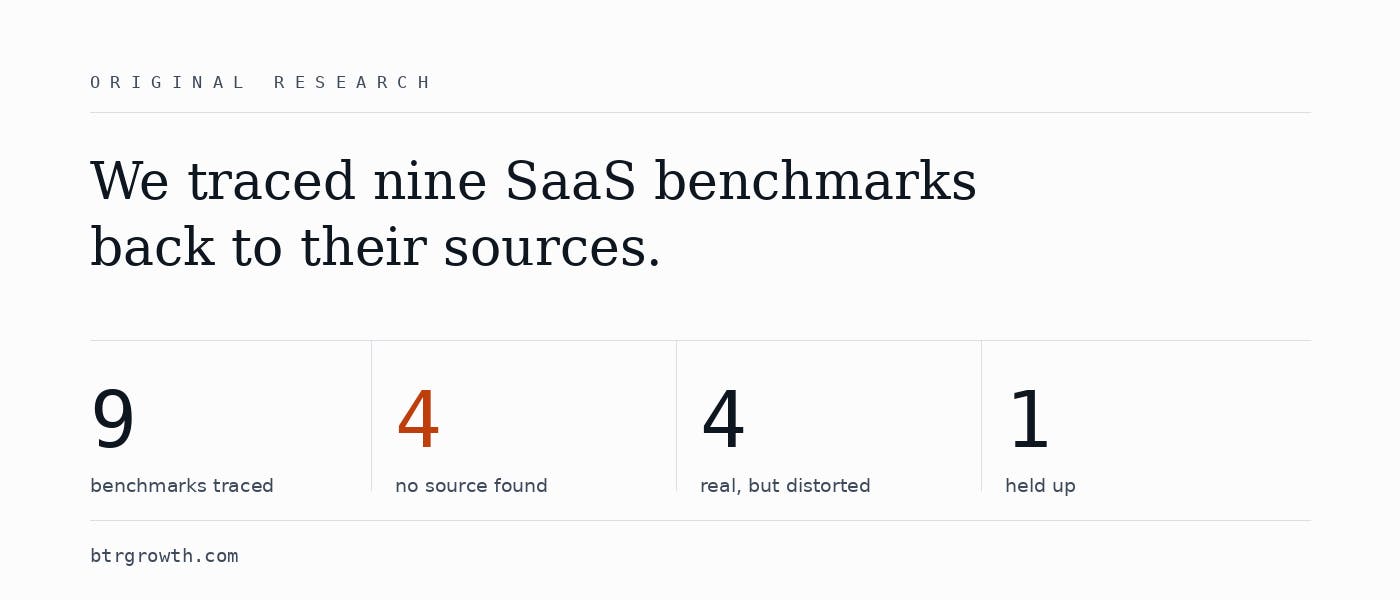
Somewhere in a sales deck that has been viewed a few hundred thousand times, there is a slide listing the standard contact-rate breakdown. Two percent of sales close on the first contact. Three percent on the second. Five on the third, ten on the fourth, and eighty percent somewhere between the fifth and twelfth.Underneath it, in the slot where the citation goes, the author wrote that the source was "a popular sales meme" and that the numbers might be slightly off. He knew. He put it in writing, in the citation field, and shipped the slide anyway. That statistic is now quoted across sales blogs, onboarding decks and vendor landing pages with a firm's name attached to it and no hint of the disclaimer. That slide is the clearest example I have found of a process that usually happens invisibly. A number gets stated. Someone repeats it with an attribution. Someone else repeats the attribution. Four hops later the qualifier is gone, the sample size is gone, the year is gone, and what remains is a bare figure that looks like evidence because it has been said often enough. I want to give you the procedure for catching this, because it is more mechanical than it sounds and it takes about fifteen minutes per number. The procedure Four steps. You can run this on any statistic before it goes into a deck, a landing page, or a pull quote. Step one: search the phrasing, not the topic. Put the claim in quotes and search the exact wording rather than the subject. You are hunting for the earliest instance, and the earliest instance is almost never the well-designed one. Expect a 2012 PDF from a consultancy nobody remembers, a conference slide deck, a comment on a forum. The ugly result is usually the important one. Step two: walk the chain one hop at a time, and write each hop down. Do not jump to the source you assume exists. Open the citing page, find what it cites, open that, repeat. The reason to write it down is that citation loops only become visible on paper. A pattern I hit repeatedly: page A credits organisation B, and the page you find on organisation B's own site credits page A. Neither one has the study. You cannot see that shape in your head, but it is obvious in a four-line list. Step three: classify what you find into three buckets, not two. "Sourced" and "unsourced" is too coarse. The three that matter are: no primary document exists; a primary document exists but reports something different from the claim; a primary document exists and is a self-reported survey by a vendor of its own users. All three get cited in identical language. Only the second and third are evidence at all, and the third is weak evidence about a specific population. Step four: check whether the scope survived. This is where most of the damage happens, and it is the step people skip. A finding that was correctly measured in a narrow context gets quoted without the context. The original might have been one industry, one year, one currency, or companies above a revenue threshold. None of those qualifiers travel well, because qualifiers make a statistic less quotable and quotability is what determines survival. What it found I ran this on nine benchmarks that circulate constantly in SaaS and B2B marketing. The full chain for each one, including the searches that came back empty, is in the write-up: we audited nine SaaS benchmarks and published the working. The compressed version: Benchmark Verdict The Rule of 40 No study. An unnamed investor's remark at a board meeting, scoped to companies above $50M revenue 5x cheaper to retain than acquire No locatable primary source, and known to have none since at least 2003 Blogging produces 67% more leads Attribution flips between five organisations, none of which link a study 80% of sales need five follow-ups Traces to a 2014 slide deck; three competing attributions 5% retention lift raises profits 25–95% Real 1990 paper. It says 25–85%, and the 85% came from one bank Email returns $42 per $1 It is £42.24, self-reported by 197 UK marketers in 2019, and later revised down 3:1 LTV:CAC A margin heuristic, now cited as research across hundreds of companies that does not exist B2B buyers are 57% through before contacting sales Real study, but the publication date drifts across three years depending on who cites it The 95:5 rule Holds up Four of the nine have no primary source I could reach. Four are real findings that arrived distorted. One survives cleanly. The three failure modes are worth naming separately Working through nine of these, the failures sorted into three shapes, and they call for different responses. The dead chain. No document at the end. The Rule of 40 is the cleanest case: Brad Feld wrote in February 2015 that he had "heard something I've not heard before from a late stage investor" at a board meeting, and passed the heuristic along with an explicit floor of $50 million in revenue. That is the entire provenance. Within days, Tomasz Tunguz ran it against public SaaS companies and found the median falling well under 40 as companies aged. The first person to check found it did not broadly hold, and the rule spread anyway, because a rule that fits in one sentence spreads faster than the analysis of it. Scope amputation. The finding is real and the qualifiers fell off. Reichheld and Sasser's 1990 paper on customer defection is real work reporting a 25 to 85 percent range, with the 85 coming from a single bank's branch system. The version in circulation says 25 to 95, and the 95 first appears in a blog post published 24 years later. Nobody fabricated anything. The number just drifted upward and shed its context, which is the direction these things always drift. Category promotion. A heuristic gets reclassified as a study. The 3:1 LTV:CAC ratio is an argument about margins: at 3:1, assuming software gross margins in the 70 to 85 percent band, there is enough left after acquisition to fund everything else. David Skok later wrote that he had made "a significant mistake in not telling my readers when it would make sense" to compute these metrics at all. I still found a live page describing it as research across hundreds of SaaS companies establishing a profitability threshold. No such research exists. The heuristic was promoted, and the promotion is now itself a citable claim. That third one is the most dangerous, because the fake version is more useful in an argument than the real one. Heuristics invite pushback. Studies end conversations. Why the loops are tightening Several pages I landed on were published in 2025 and 2026, cited each other, and cited nothing outside that circle. That is new. Older chains at least terminated in something, even if the something turned out to be a slide. Language models accelerate this in a specific and mechanical way. Ask an assistant for a benchmark and you get the number, usually with an organisation's name attached, and almost never with the hop count, the fieldwork year, the sample size, or a note that the range is wide because the underlying studies are unnamed. The output is the most-repeated variant, which for most of the nine above is also the most-degraded variant. That answer gets pasted into a post, and the post feeds the next answer. The circle closes without anyone deciding to close it. Bad numbers have always survived by being repeated. What is different now is that the repetition is fast, free, and leaves no fingerprints. Run it on something you already believe Pick a statistic you have quoted in the last month and put it through the four steps. Then answer these before you use it again: How many hops to a primary document? If it takes more than three, treat that as a failure, not a research problem. Does that document report the same figure for the same population as the claim? What is the sample size for this specific metric, not for the survey it sat inside? What year is the fieldwork, and has the publisher revised it since? Revisions almost never propagate. Did the scope survive? Industry, currency, company size, time window. If a number fails these, you have two honest options. Drop it, or label it as folklore and quote it as folklore. The second option is better than it sounds. "Most people in this market assume X" is a true statement that tells a reader something real. "Research shows X" is a different claim, and if the research does not exist, you have borrowed credibility you cannot repay. The nine chains are published in full, dead ends included, so anyone can check the work or overturn it. If you find a primary source for one of the four I could not trace, I would like to see it.
How to Check Whether a Benchmark Actually Has a Source
Full Article
Original Source
Read the full article at Hackernoon →KhanList aggregates and links to publicly available news content. We do not host full articles from third-party sources. Always verify important information with original sources.