
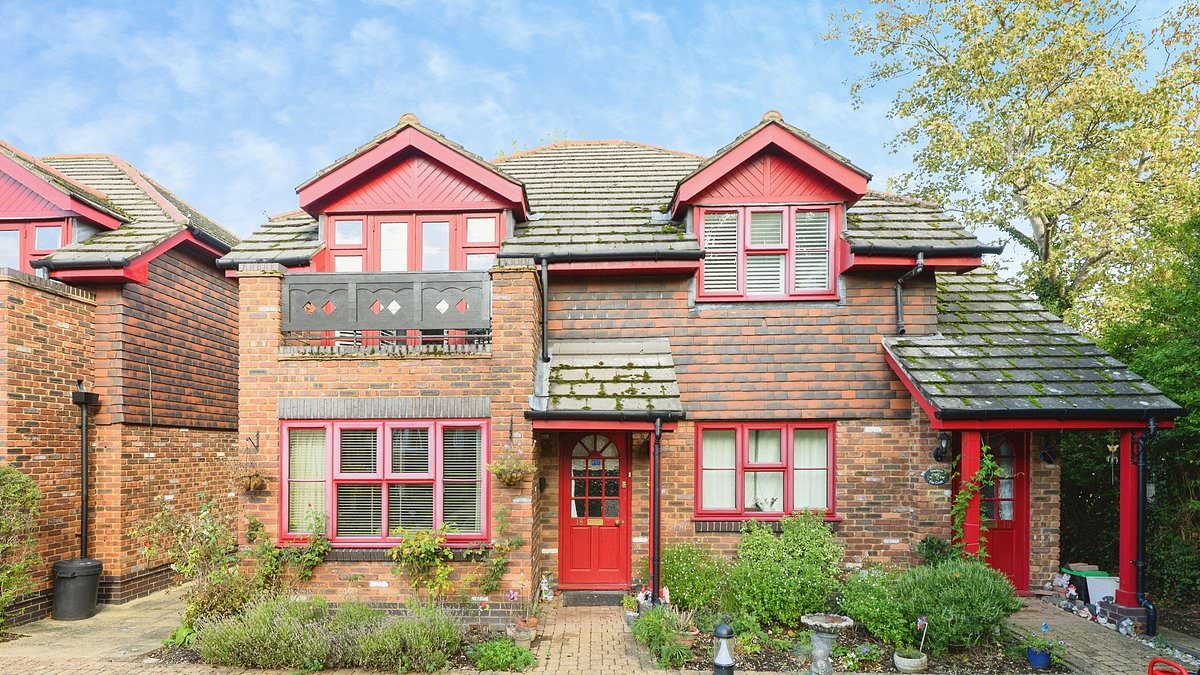
UK house prices have increased over the past year despite a sharp slowdown in property sales. The latest figures reveal that the average UK house price reached £273,000 in September 2026, representing annual growth of 1.2 per cent, according to the latest House Price Index.But while property values have continued to edge upwards, activity in the housing market has slowed considerably, with 19,205 fewer homes sold across the UK in July 2026 compared with the same month last year.The figures suggest that despite fewer properties changing hands, house prices have remained resilient over the past 12 months.England accounted for the overwhelming majority of the decline in sales, recording 18,191 fewer transactions - a fall of almost a third (31 per cent). Wales also saw sales drop by 1,219, while Scotland bucked the trend with 342 more sales. The latest figures show that the annual increase in property values has been felt differently across the country, with northern regions generally recording stronger growth than the south.Homeowners in the North East have enjoyed the biggest annual increase of any English region, with property values rising by 4.6 per cent to an average of £166,649.The North West also performed strongly, recording annual growth of 3.2 per cent, taking the average house price to £220,477. A house in Epsom, where average property prices have risen by £22,040 over the past year to £562,395, according to the latest figures A residential property in Epsom, one of the UK's strongest-performing areas for house price growth, with average values reaching £562,395 A look inside a home in Epsom, where property prices have risen by almost £22,000 over the past yearYorkshire and the Humber saw values rise by 2.9 per cent to £210,799, according to the Office for National Statistics House Price Index, released on Wednesday, November 18.The Midlands also recorded steady growth, while prices across much of the South of England were largely unchanged or fell.Although the average UK house price slipped by 0.5 per cent between August and September, the bigger picture remains one of annual growth.While the UK average has increased over the past year, London has continued to struggle, with property values falling in 22 of the capital's 33 boroughs.Around two-thirds of London homes lost value over the 12 months to September 2026, with the average property price falling by 3.5 per cent to approximately £545,579.Some of the capital's most expensive areas recorded particularly significant losses.Kensington and Chelsea saw average property values fall by £216,327 to around £1.7million. Despite the decline, it remains London's most expensive borough.Westminster recorded a £195,240 fall, taking the average property value to £861,130, while homes in the City of London lost £138,678 to reach approximately £663,585. A property in Elmbridge, where average house prices have increased by £23,301 in the past year to £740,883 Inside this Elmbridge home, where property values have risen over the past 12 months Inside one of Elmbridge's homes, in an area where property values have increased by £23,301 since last yearDespite the wider slowdown across London and the South of England, some commuter towns surrounding the capital have recorded substantial annual increases in property values.St Albans, just north of London, was the UK's best-performing area, with average house prices climbing by £35,856 over the year to £666,824.Elmbridge, south-west of the capital, followed with an increase of £23,301, taking the average house price to £740,883.Meanwhile, Epsom and Ewell, south of London, recorded a £22,040 increase, bringing the average property value to £562,395.The figures highlight how differently homeowners across the country have fared over the past year.While the average UK property has gained around £3,000 in value, regional differences mean some homeowners have enjoyed much bigger increases, while others have seen their properties lose value.Tom Evans, Sales Director at Purplebricks Estate Agency, said: 'There's good reason for homeowners to be optimistic, with the market continuing to show resilience despite the challenging economic backdrop.'While house prices have faced more pressure and buyer demand remains subdued, the recent rise in the Bank of England's base rate to 4% seems another setback for borrowers.'However, wages are on the rise and the UK economy grew by 0.7% in the third quarter of 2026, up from 0.5% in the previous quarter, easing affordability and motivating more buyers to move home.'With the gap between earnings and house prices beginning to narrow, we're hopeful buyer confidence will recover and help drive the market forward in the months ahead.' Winners - SEP 2026 vs SEP 2025 LOCATIONSt AlbansElmbridgeEpsom and EwellNewry Mourne and DownMaldonLisburn and CastlereaghArmagh City Banbridge and CraigavonBarking and DagenhamTraffordHart CHANGE £ 35,85623,30122,04020,20219,17519,13618,65718,210 17,77416,924 VALUE £666,824740,883562,395228,504406,165244,983194,132 372,551394,017483,876 Losers - SEP 2026 vs SEP 2025 LOCATIONKensington and ChelseaCity of WestminsterCity of LondonCamdenHammersmith and FulhamTower HamletsInner LondonLambethWandsworth Islington CHANGE £ -216,347-195,250- 138,678 - 87,225-53,847-53,564-48,041-38,996- 38,123- 34,681 VALUE £1,170,938861,130663,585789,180732,590456,306621,491534,609692,067672,151
House sales slump as prices show steady growth since 2025 - but how much is YOUR home worth now?
Full Article
Original Source
Read the full article at Dailymail →KhanList aggregates and links to publicly available news content. We do not host full articles from third-party sources. Always verify important information with original sources.