
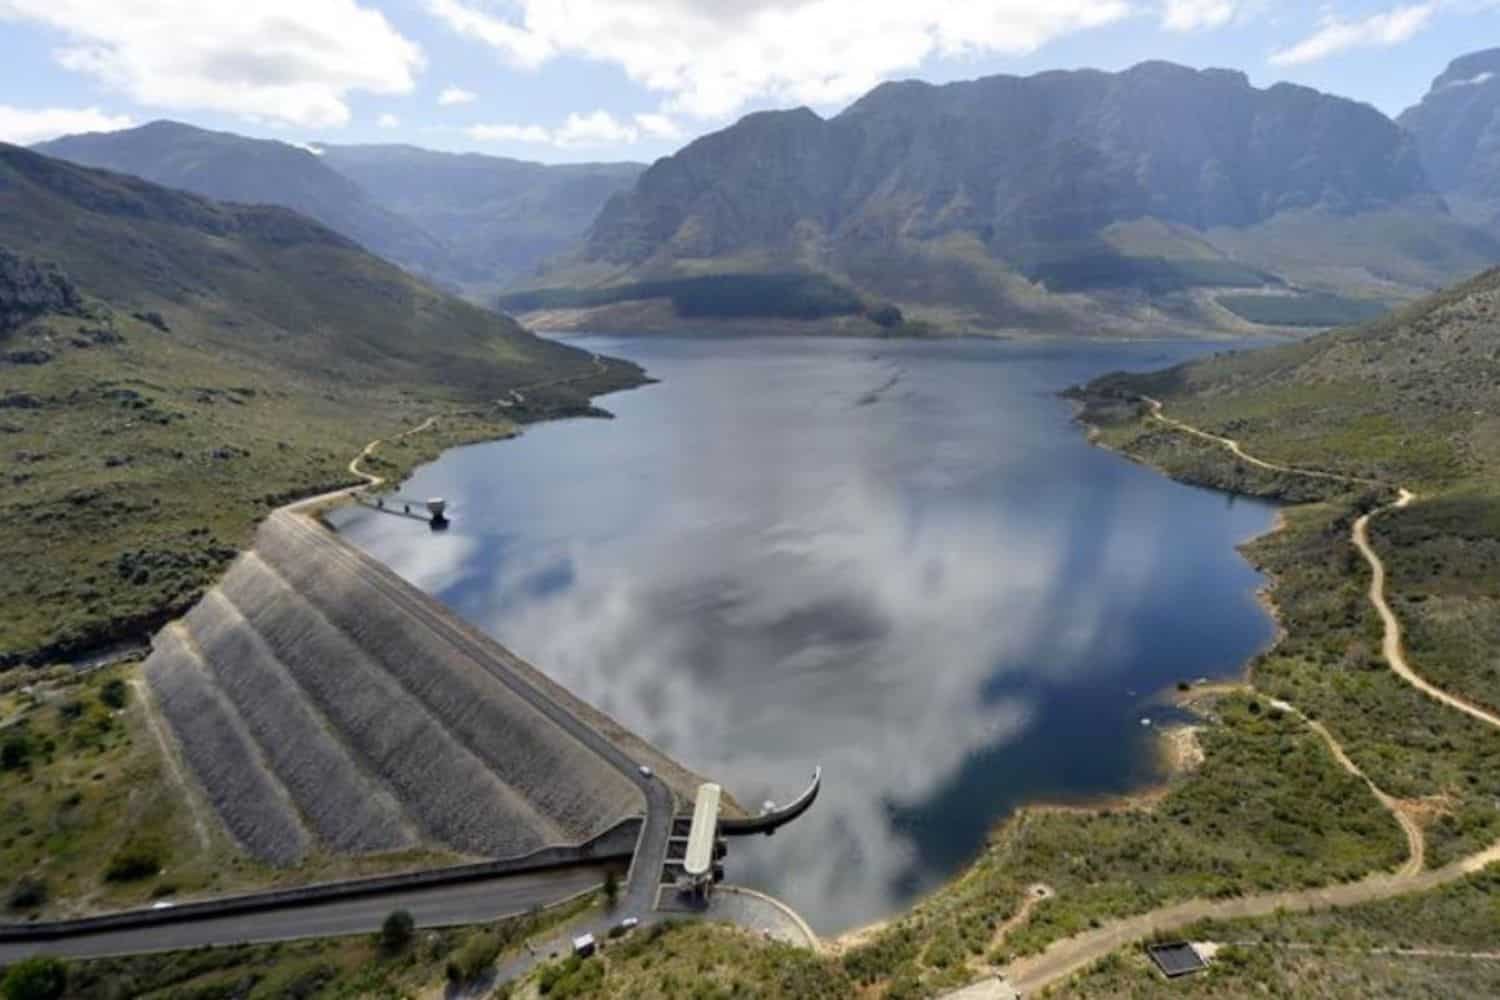
Levels dropped at every dam in the week to 16 November. Cape Town’s major dams held 69.3% of their combined capacity on Friday, according to the latest daily reading. This was a slight decrease from the previous day’s 69.8%. Together, the dams stored 622 025 megalitres (Ml) out of a possible 898 221 Ml. Latest dam levels in Cape Town Several of Cape Town’s dams saw decreases in their water storage levels in just a few hours from Thursday to Friday. On Thursday, Steenbras Upper was at 100.3%, the highest level, and decreased to 99.5% on Friday. Meanwhile, Steenbras Lower was the lowest at 44.7% on the same day and went even lower on Friday, reaching 45.5%. Berg River stood at 92.7%, and slightly decreased to 92.0% on Friday, and Wemmershoek went up from 73.1%, to 72.8% in a couple of hours. Theewaterskloof, the largest dam, held 69.4% on Thursday, slightly reaching 69.2% by Friday. Voëlvlei held 51.0%, before decreasing to 49.1%. Total storage slipped from 70.4% on Monday. “Because each dam size is different, the best indicator of overall dam water levels is the total quantity stored expressed as a percentage of total dam capacity,” the report explained. Dam levels this week compared with last week Levels dropped at every dam in the week to 16 November. According to the weekly table, total storage fell from 71.7% to 70.4%, a loss of approximately 12 347 Ml. Wemmershoek recorded the steepest drop, sliding from 76.9% to 74.2%. Voëlvlei fell from 53.0% to 51.1%, and Theewaterskloof from 71.3% to 70.1%. Steenbras Lower slipped from 46.7% to 45.5%, while Steenbras Upper eased from 100.6% to 99.9%. Berg River dipped from 94.1% to 93.2%. Dam levels this week compared with last year Storage was far lower than at the same time in 2025. The report showed total storage at 83.8% last year, compared with 70.4% now, which was about 121 007 Ml less water. Voëlvlei recorded the biggest gap, falling from 93.9% to 51.1%. Steenbras Lower also dropped sharply from 83.3% to 45.5%. Theewaterskloof fell from 77.5% to 70.1%, and Wemmershoek from 80.6% to 74.2%. Only two dams were higher than last year. Berg River rose from 92.2% to 93.2%, and Steenbras Upper from 99.3% to 99.9%. Western Cape Water Supply System The dams served more than the city itself. Their water also reached the Overberg, Boland, West Coast, and Swartland areas, and supported farm irrigation. “The dams in and around Cape Town form part of the Western Cape Water Supply System, which is an integrated and collectively managed system of dams, pump stations, pipelines, and tunnels,” the report noted.
Cape Town dam levels dip overnight: Here’s how this week compares with last year
Full Article
Original Source
Read the full article at Citizen →KhanList aggregates and links to publicly available news content. We do not host full articles from third-party sources. Always verify important information with original sources.