
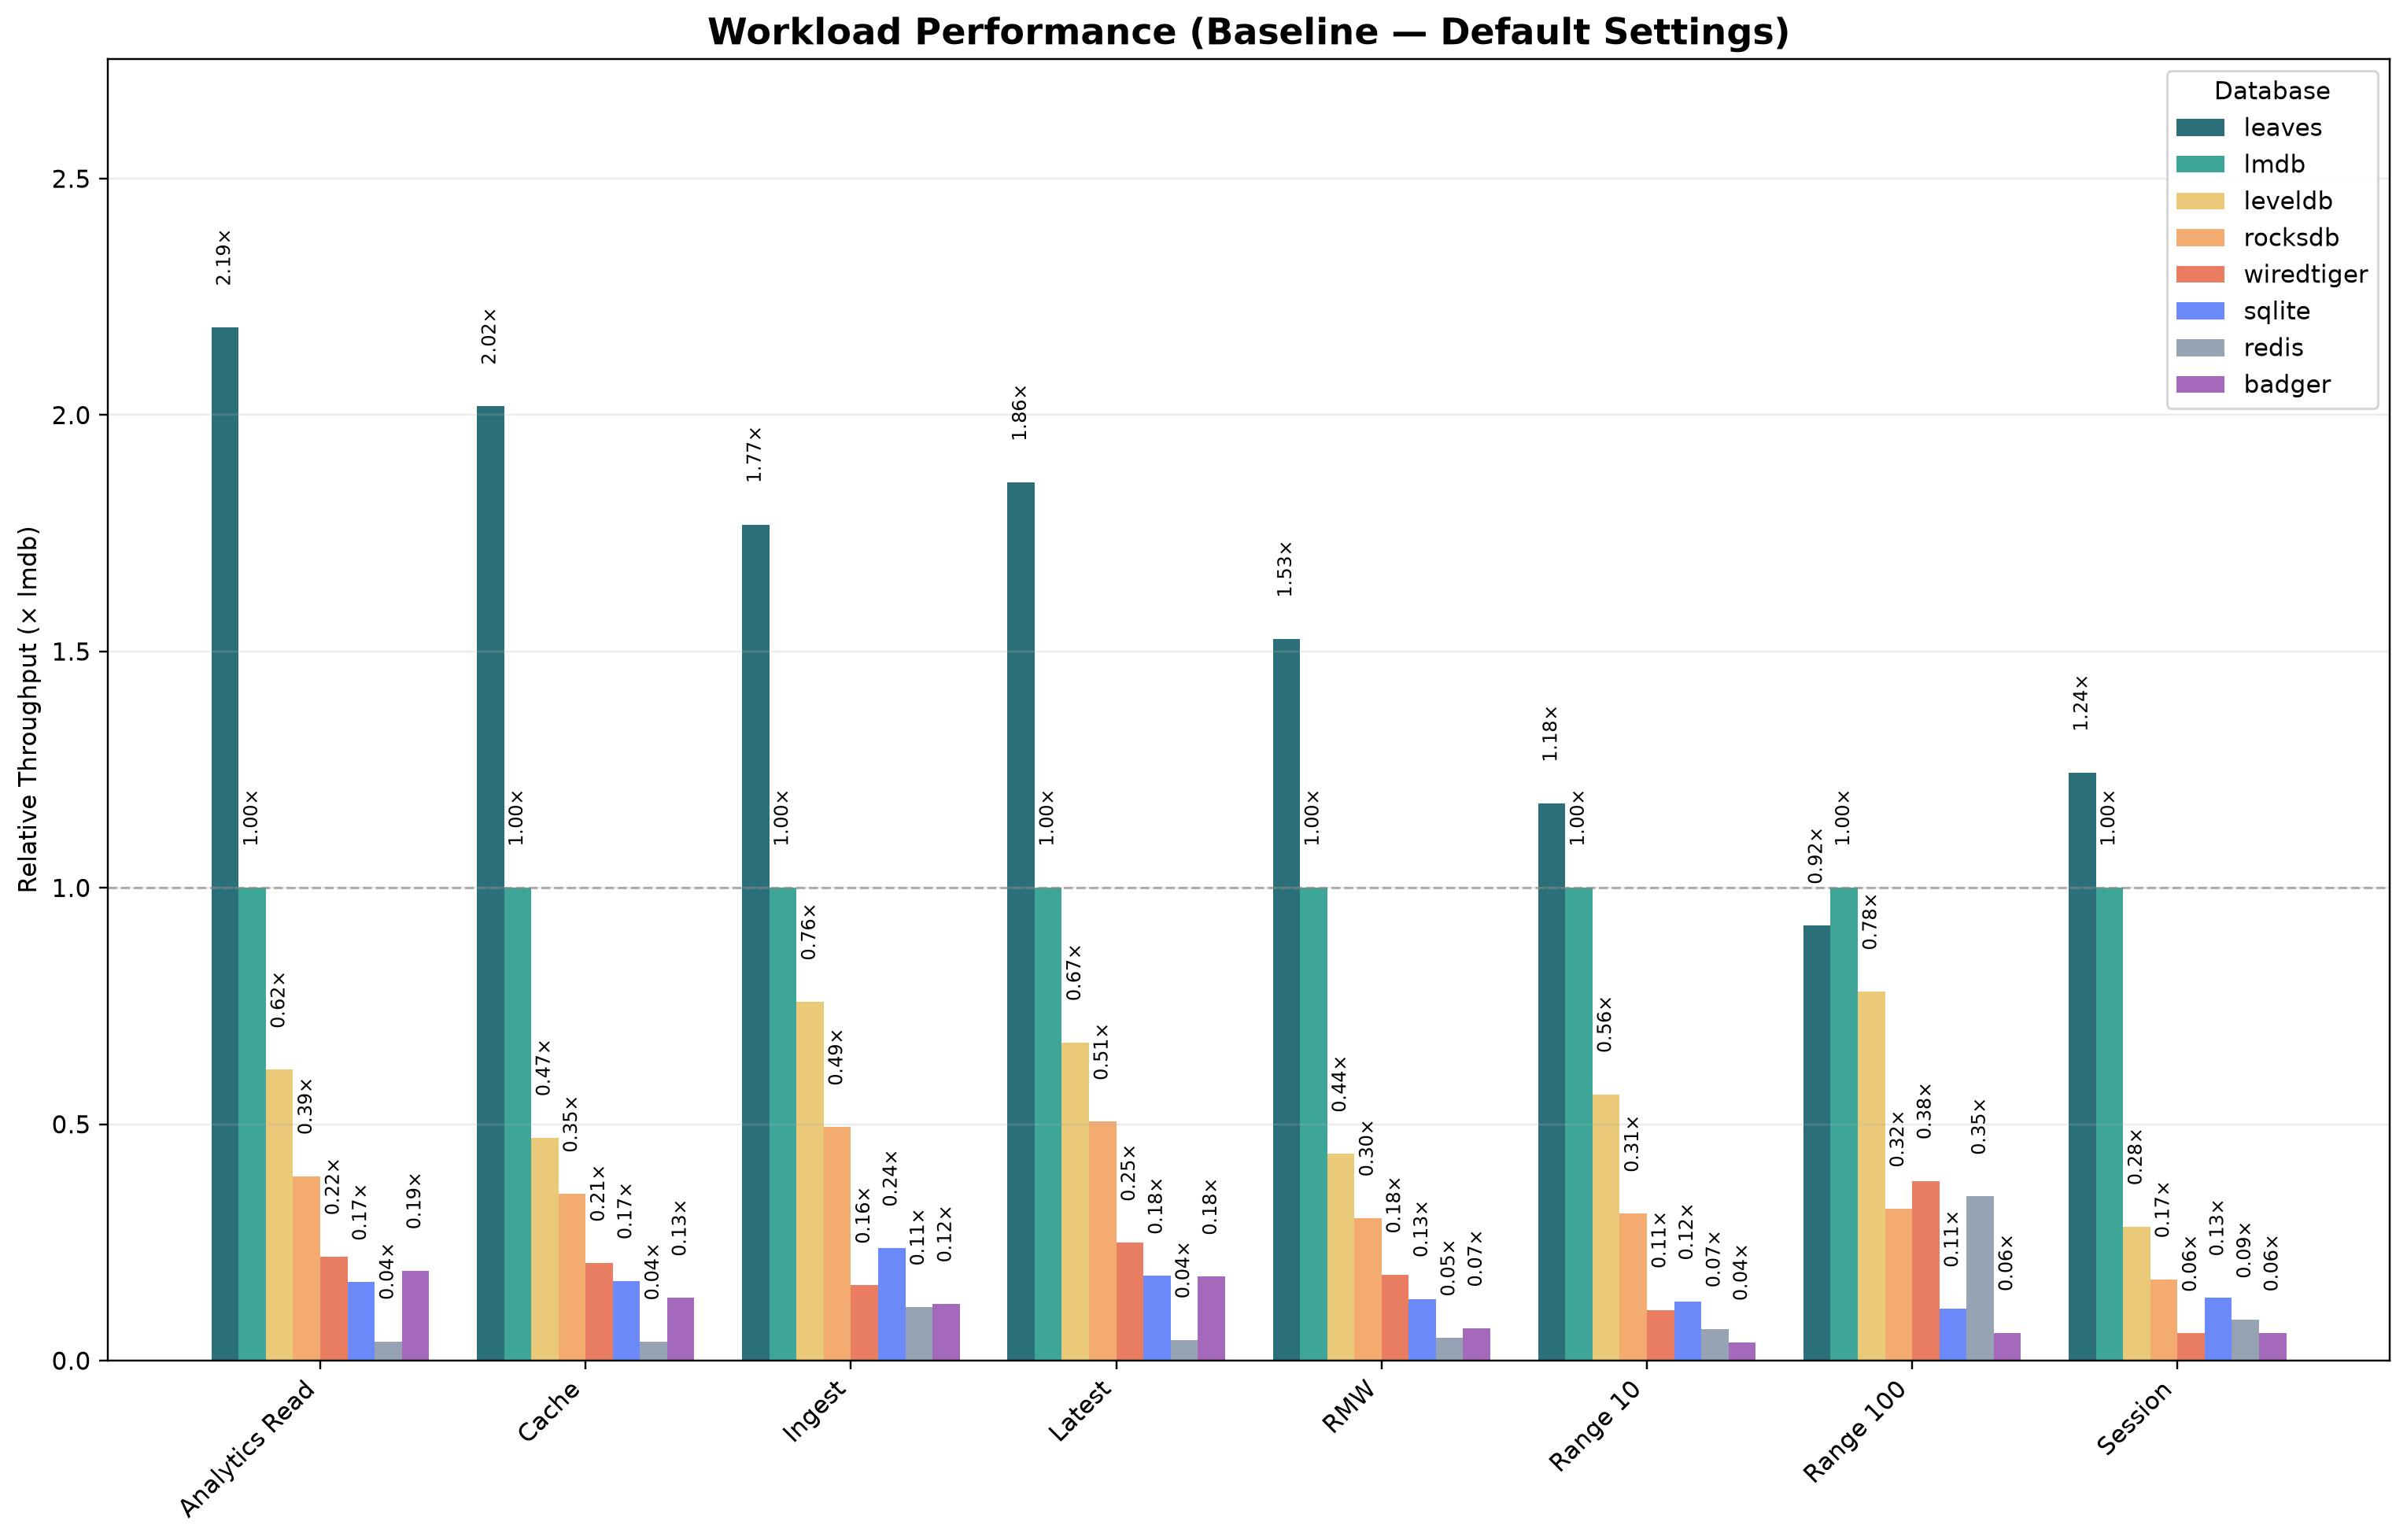
The database literature has long centered on a small set of storage architectures: B-trees, LSM trees, and their many variants. This article examines a different approach: a persistent trie design for embedded key-value storage.To make the comparison concrete, the evaluation includes LMDB as a widely used high-performance baseline. Most published benchmarks omit LMDB entirely, which makes it difficult to interpret what “fast” means in practice. This article therefore uses LMDB as a reference point and compares it against a range of widely used engines under comparable conditions. All databases are configured for high performance using recommended and engine-specific settings where applicable. This includes batching, cache sizing, binary keys, and other engine-specific optimizations. ACID workloads are evaluated separately with strict durability enabled. The goal is simple: measure how these systems perform against a known high-performance reference. The results suggest that a persistent-trie design can be highly competitive, and in several scenarios it clearly outperforms the baseline and other tested systems. Executive Results Single-thread Comparison Across the tested workloads, a clear performance pattern emerges. LMDB remains a strong baseline and is often faster than traditional embedded competitors, reaching up to approximately 6× higher throughput than WiredTiger and SQLite in read-heavy workloads and roughly 1.3–3.5× higher throughput than LevelDB and 2–6× higher throughput than RocksDB across the single-threaded workloads. WiredTiger is often limited by internal overhead, while Redis is shaped strongly by network round-trip costs rather than storage performance.The persistent-trie design represented by Leaves also shows a distinct profile. In several standard workloads it is roughly 1.5–2.2× faster than LMDB, while the gap narrows or reverses on longer scans. Leaves is also the top performer in the concurrent table, and the ACID workloads show lower absolute throughput because durability costs dominate. Benchmark fairness All systems were configured for maximum throughput using recommended settings where available. This includes cache sizing, batching, and binary keys. ACID workloads are evaluated separately with full durability enabled. The goal is not to compare default configurations, but to measure the achievable performance of each system under comparable conditions. Once the settings are normalized, the remaining question is architectural: how different storage designs influence lookup cost, write amplification, and scalability under the same workload patterns. The Contenders Engine Type Architecture LMDB Embedded B+ tree, memory-mapped, copy-on-write LevelDB Embedded LSM tree, SSTables RocksDB Embedded LSM tree (optimized LevelDB fork) WiredTiger Embedded B-tree / LSM hybrid SQLite Embedded B-tree with SQL layer BadgerDB Embedded LSM + value log (Go via CGo) Redis Client/Server In-memory hash tables Leaves Embedded Trie-based, memory-mapped, copy-on-write Single threaded Workload Scenario Breakdown Analytics Read (100% read) Scenario: This workload represents read-only serving layers such as feature stores, recommendation systems, and profile lookup services, where precomputed data is accessed at high rates with strong locality. Configuration: The workload uses readproportion=1.0 with a zipfian distribution over one million records. RocksDB and LevelDB use a 1 GB block cache (rocksdb.cache_size, leveldb.cache_size). WiredTiger is forced into B-tree mode by disabling LSM parameters. Binary keys are enabled where supported. Dataset: 1,000,000 records Operations: 500,000 Key size: 8 B (binary) Value size: 1 KB (10×100 B) Explanation: Performance is dominated by lookup cost. LSM engines must consult multiple structures, while B-tree engines require logarithmic traversal with comparator overhead, resulting in a cost of O(k · log n). The trie-based structure used by Leaves performs lookups in O(k), depending only on key length and independent of dataset size. Measured median run throughput (ops/sec) used in charts: badger leaves leveldb lmdb redis rocksdb sqlite wiredtiger 176734.0 2031095.0 571787.5 929380.5 38020.3 362670.5 154385.0 204652.5 Cache (95% read / 5% update) Scenario: This workload models metadata and profile lookup services with a small number of frequently accessed keys. Configuration: Uses readproportion=0.95 with zipfian distribution. RocksDB and LevelDB use 1 GB cache. WiredTiger operates in B-tree mode. No batching is applied. Dataset: 1,000,000 records Operations: 2,000,000 Key size: 8 B (binary) Value size: 1 KB (10×100 B) Explanation: Same lookup-dominated behavior as Analytics Read; see above for structural differences (LSM vs B-tree vs trie). Measured median run throughput (ops/sec) used in charts: badger leaves leveldb lmdb redis rocksdb sqlite wiredtiger 125223.5 1902215.0 444328.0 942267.5 37834.95 332166.5 159045.0 194076.5 Ingest (70% insert / 20% update / 10% read) Scenario: Represents event ingestion pipelines such as logging and telemetry systems. Configuration: Uses insertproportion=0.70 with uniform distribution and insertorder=hashed. Batching (batch_size=64) and binary keys are enabled across engines. Dataset: 1,000,000 records Operations: 1,000,000 Key size: 8 B (binary) Value size: 1 KB (10×100 B) Explanation: Write throughput dominates. LSM engines benefit from sequential write buffering, while B-tree engines must locate the insertion position and perform structural updates on each write. The trie-based structure used by Leaves finds the insertion position in O(k) time and avoids rebalancing or restructuring operations required by B-trees. Measured median run throughput (ops/sec) used in charts: badger leaves leveldb lmdb redis rocksdb sqlite wiredtiger 47464.75 698659.5 299827.5 395069.0 44773.5 195189.0 93981.9 63008.55 Latest (95% read / 5% insert) Scenario: Models recency-biased systems such as activity feeds and monitoring dashboards. Configuration: Uses requestdistribution=latest. RocksDB and LevelDB use 1 GB cache. WiredTiger operates in B-tree mode. Dataset: 1,000,000 records Operations: 1,000,000 Key size: 8 B (binary) Value size: 1 KB (10×100 B) Explanation: Same lookup/update trade-offs as Ingest and Analytics Read; locality helps LSM, but trie lookup still avoids comparator overhead. Measured median run throughput (ops/sec) used in charts: badger leaves leveldb lmdb redis rocksdb sqlite wiredtiger 167109.0 1745825.0 632776.0 940119.5 41149.45 475148.5 168543.0 234241.0 RMW (Read-Modify-Write) Scenario: Represents counters and mutable records where each operation reads and updates data. Configuration: Uses readproportion=0.50 and readmodifywriteproportion=0.50. RocksDB and LevelDB use 1 GB cache. WiredTiger operates in B-tree mode. Dataset: 1,000,000 records Operations: 1,000,000 Key size: 8 B (binary) Value size: 1 KB (10×100 B) Explanation: Combination of Analytics Read (lookup) and Ingest (write path); see those sections for details. Measured median run throughput (ops/sec) used in charts: badger leaves leveldb lmdb redis rocksdb sqlite wiredtiger 44104.05 985735.5 282501.0 645856.0 31184.35 194754.5 84407.0 117180.0 Range 10 Scenario: Represents short pagination queries and recent history lookups. Configuration: Uses fixed scan length of 10 with zipfian distribution. RocksDB and LevelDB use 1 GB cache. WiredTiger uses B-tree mode with larger leaf pages. Dataset: 1,000,000 records Operations: 1,000,000 Key size: 8 B (binary) Value size: 1 KB (10×100 B) Explanation: This workload is still largely dominated by the lookup cost of the starting key, as only a small number of subsequent entries are scanned. LSM engines incur additional overhead due to merging across levels during iteration, while B-tree engines benefit from ordered leaf traversal once the starting point is found. The trie-based structure used by Leaves provides faster lookup of the starting key, but offers less advantage during sequential traversal. As a result, performance reflects a balance between lookup efficiency and short-range scan cost. Measured median run throughput (ops/sec) used in charts: badger leaves leveldb lmdb redis rocksdb sqlite wiredtiger 24928.5 753185.0 360244.0 639335.0 42868.6 198695.0 79862.85 68644.65 Range 100 Scenario: Represents larger scans such as batch export or analytics queries. Configuration: Same as Range 10 but with scan length 100. Dataset: 1,000,000 records Operations: 500,000 Key size: 8 B (binary) Value size: 1 KB (10×100 B) Explanation: As scan length increases, traversal cost and data locality become dominant factors. LSM engines incur additional overhead due to multi-level merging during scans. B-tree engines benefit from strong data locality, as records are stored in contiguous pages, allowing efficient sequential access once the scan begins. While the trie-based structure used by Leaves provides faster random access to the scan start, its layout is less optimized for long sequential scans. As a result, LMDB outperforms Leaves in this workload: for short ranges, the faster lookup compensates for scan cost, but for larger ranges, the data locality advantage of LMDB becomes dominant. Measured median run throughput (ops/sec) used in charts: badger leaves leveldb lmdb redis rocksdb sqlite wiredtiger 7131.305 110989.5 94181.5 120646.5 41924.55 38729.25 13210.3 45866.7 Session (50% read / 50% update) Scenario: Models user session storage with frequent reads and updates. Configuration: Uses readproportion=0.50 and updateproportion=0.50 with batching and binary keys enabled. RocksDB and LevelDB use 1 GB cache. WiredTiger operates in B-tree mode. Dataset: 5,000,000 records Operations: 5,000,000 Key size: 8 B (binary) Value size: 1 KB (10×100 B) Explanation: Mixed workload; combines effects described in Analytics Read and Ingest. To be comparable with the Concurrent Session scenario, it has the same total number of operations but is executed single-threaded. Measured median run throughput (ops/sec) used in charts: badger leaves leveldb lmdb redis rocksdb sqlite wiredtiger 32089.45 681301.0 155372.0 548179.5 47262.15 94179.35 73105.35 31624.0 Batch Insert Batch Insert Scaling Scenario: Represents buffered ingestion systems such as event batching, log aggregation, or bulk data import pipelines. Configuration: Uses insertproportion=0.80, updateproportion=0.15, readproportion=0.05, insertorder=hashed, batch sizes (batch_size ∈ {1,8,32,64}), and binary keys. Dataset: 1,000,000 records Operations: 1,000,000 Key size: 8 B (binary) Value size: 1 KB (10×100 B) Explanation: Batching amortizes commit and synchronization costs across multiple operations. LSM engines benefit from write buffering and sequential I/O, while B-tree engines must still locate the insertion position and perform structural updates for each insert. For copy-on-write engines such as LMDB and Leaves, batching reduces the number of copy-on-write operations by grouping multiple updates into a single transaction, significantly reducing data duplication and write amplification. Measured median run throughput (ops/sec) used in charts: batch_size badger leaves leveldb lmdb redis rocksdb sqlite wiredtiger 1 36285.4 652103.0 344169.0 395483.0 39230.35 204408.0 87304.5 61494.15 8 95144.85 791149.0 410734.0 421997.0 78239.2 259998.5 157418.0 60181.25 32 108853.55 809464.5 422211.0 416289.0 86677.15 258835.5 170060.5 61650.9 64 111067.45 807846.0 413444.5 413224.0 89115.35 265556.5 163951.5 61670.85 Batch Update Batch Update Scaling Scenario: Represents bulk modification workloads such as periodic state updates, counter refreshes, or large-scale metadata updates. Configuration: Uses updateproportion=0.80, readproportion=0.20, zipfian distribution, batch sizes (batch_size ∈ {1,8,32,64}), and binary keys. Dataset: 1,000,000 records Operations: 1,000,000 Key size: 8 B (binary) Value size: 1 KB (10×100 B) Explanation: Batching reduces commit overhead by grouping updates into fewer transactions. LSM engines still incur write amplification as updates propagate through levels, while B-tree engines must perform structural updates per operation. For copy-on-write engines such as LMDB and Leaves, batching reduces copy-on-write operations, allowing multiple updates to be applied within a single version of the data. Measured median run throughput (ops/sec) used in charts: batch_size badger leaves leveldb lmdb redis rocksdb sqlite wiredtiger 1 21777.1 856156.0 240947.5 601852.5 43843.85 149569.5 108914.0 87625.75 8 55622.8 1049320.0 262315.0 635657.0 94276.8 172850.5 197483.0 85776.85 32 57138.3 1088365.0 257429.0 641154.0 110449.0 179215.0 218616.5 88082.95 64 41807.65 1078825.0 268426.5 639765.5 113733.0 176215.0 220814.0 95338.9 ACID Workload Scenarios ACID Comparison ACID A/C/I Scenario: This workload models transactional update patterns under strict durability constraints. Each operation consists of a mix of reads, updates, and read-modify-write operations (25% reads, 35% updates, 40% RMW) executed with full synchronization guarantees. It approximates systems that require atomic updates to individual records while maintaining consistency and isolation. Configuration: Uses batch_size=1 with a 25/35/40 read/update/RMW mix, zipfian key access, hashed inserts, and strict durability settings. Dataset: 1,000,000 records Operations: 10,000 Key size: 8 B (binary) Value size: 1 KB (10×100 B) Explanation: Durability dominates; same fsync/logging effects as in ACID Transactions. Measured median run throughput (ops/sec) used in charts: badger leaves lmdb sqlite wiredtiger 1736.985 3857.055 2167.625 3644.49 1122.04 ACID Transactions Scenario: This workload models explicit multi-key transactions. Each operation executes a transaction that reads multiple keys and updates them atomically within a single commit. The workload therefore measures the cost of coordinating multi-key updates under strict durability and isolation guarantees, similar to financial transfers or strongly consistent state transitions. Configuration: Uses batch_size=2 with a 50/50 read/update mix, zipfian key access, hashed inserts, and strict durability settings. Dataset: 1,000,000 records Operations: 10,000 Key size: 8 B (binary) Value size: 1 KB (10×100 B) Explanation: Same durability and coordination costs as ACID A/C/I, with additional multi-key overhead. Measured median run throughput (ops/sec) used in charts: badger leaves lmdb sqlite wiredtiger 878.774 5741.205 3062.945 4714.745 4339.68 ACID Batch RMW Scenario: This workload models batched atomic read-modify-write transactions across multiple keys. Each transaction performs 8 read-modify-write pairs in one commit, exercising multi-key atomicity and rollback behavior under strict durability guarantees. It approximates real-world patterns such as fund transfers across accounts, coordinated inventory adjustments across SKUs, or multi-document patching in one transaction. Configuration: Uses readmodifywriteproportion=1.0 with batch_size=8, zipfian key access (requestdistribution=zipfian), and hashed key insertion (insertorder=hashed, hashalgo=sha256). RocksDB and LevelDB are configured with 1 GB cache (rocksdb.cache_size, leveldb.cache_size) to cover the working set. WiredTiger is forced to B-tree mode by disabling LSM parameters. Dataset: 1,000,000 records Operations: 10,000 Key size: 8 B (binary) Value size: 1 KB (10×100 B) Explanation: Each transaction contains 8 RMW pairs (8 reads + 8 writes, 16 DB calls total), so 10,000 operations correspond to 1,250 transactions. Throughput is primarily determined by durability and transaction coordination cost: each commit must synchronize persistent state while preserving all-or-nothing semantics across multiple keys. Compared to non-transactional RMW, this adds commit and rollback overhead on top of the read-before-write path. Measured median run throughput (ops/sec) used in charts: badger leaves lmdb sqlite wiredtiger 4380.145 15443.55 8746.595 7835.615 9809.035 Concurrent Workloads Concurrent Comparison LMDB is not included in the concurrent workloads because LMDB supports only a single concurrent writer. The concurrent benchmarks therefore focus on engines that can execute the workload with multiple simultaneous writers. Instead sqllite results are used as baseline.Concurrent Session (8 threads) Scenario: Represents multi-threaded web backends handling user sessions. Configuration: Uses threadcount=8 with a 50/50 read/update mix and zipfian key access. Leaves uses confluence format with merge_threshold=64. RocksDB uses 2 GB cache. WiredTiger uses 4 GB cache and B-tree mode. Dataset: 5,000,000 records Operations: 5,000,000 Key size: 8 B (binary) Value size: 1 KB (10×100 B) Explanation: Concurrency introduces contention. RocksDB benefits from concurrent write support. Leaves isolates writes per thread and merges asynchronously, achieving higher scalability. Measured median run throughput (ops/sec) used in charts: badger leaves redis rocksdb sqlite wiredtiger 40782.25 2765700.0 95549.95 251111.5 93333.55 32034.05 Concurrent Write (8 threads) Scenario: Represents high-throughput ingestion systems with many parallel writers. Configuration: Uses insertproportion=0.70, threadcount=8, and uniform key access. Leaves uses confluence format with a 256 GB mapsize, merge_threshold=128000, and heap_writeback_bytes=8388608. RocksDB and WiredTiger increase cache sizes. Dataset: 5,000,000 records Operations: 5,000,000 Key size: 8 B (binary) Value size: 1 KB (10×100 B) Explanation: Write scalability depends on contention. LSM engines scale via buffering but still share structures. B-tree engines are limited by centralized updates. Leaves distributes writes across threads and merges them asynchronously, resulting in superior scalability. Measured median run throughput (ops/sec) used in charts: badger leaves redis rocksdb sqlite wiredtiger 20776.0 213240.5 78876.2 67818.1 47858.8 9965.99 Benchmark Benchmarks are executed using a modified YCSB-cpp:https://github.com/kochelmonster/YCSB-cpp YCSB was used as the starting point because it is a widely used benchmark framework for database systems. But while starting benchmarking several flaws turned up in the original YCSB. That led first to YCSB-cpp, and then to its modification. The main issues in the original benchmark framework were: High framework overhead: a significant part of runtime was spent in benchmark code instead of database operations. Incomplete transaction support: transaction handling was hardcoded and covered only a single scenario. Poor run-to-run comparability: different benchmark runs used different datasets, making fair cross-run comparisons difficult. How measuring is done Each scenario is repeated 8 times, the displayed throughput is the median of the 8 runs. The numbers can be reproduced by running BENCHMARK_REPEATS=8 ./run_all_benchmarks.sh in the benchmark directory. Benchmark overhead Modern key-value stores can be so fast that even small benchmark overheads distort the results. To quantify this, the same workloads were profiled against LMDB using both the original and optimized YCSB-cpp versions. Using Linux perf with per-shared-object attribution, the fraction of application CPU time spent inside the database versus the benchmark framework was measured. Workload Version DB time Framework time Framework overhead Analytics Read Original 37.5% 23.5% 38.5% Analytics Read Optimized 57.2% 8.4% 12.8% RMW Original 37.6% 23.1% 38.0% RMW Optimized 53.6% 11.2% 17.3% Batch Insert Original 27.8% 25.4% 47.8% Batch Insert Optimized 28.7% 24.9% 46.5% Framework overhead = Framework / (Framework + DB) In read-heavy workloads, the unoptimized benchmark wastes nearly 40% of application CPU time outside the database. After optimization, this drops to roughly 13–17%. Batch insert workloads show similar overhead in both versions because commit cost dominates, making framework overhead relatively less visible. Throughput impact Workload Original YCSB-cpp Optimized YCSB-cpp Speedup Analytics Read 782,150 ops/sec 1,129,890 ops/sec 1.44× RMW 402,996 ops/sec 610,086 ops/sec 1.51× Batch Insert 176,398 ops/sec 193,318 ops/sec 1.10× How overhead biases comparisons Benchmark overhead adds a roughly constant per-operation cost. Faster databases complete their work quickly → overhead becomes a larger fraction Slower databases spend more time in actual work → overhead is less visible This compresses the apparent performance gap. Example (LMDB vs LevelDB): Benchmark LMDB ops/sec LevelDB ops/sec Ratio Original 782,150 474,798 1.65× Optimized 1,129,890 622,623 1.81× The unoptimized benchmark underestimates the true performance difference. This effect applies to all fast engines. All results in this article use the optimized benchmark to ensure measurements reflect actual database performance rather than framework artifacts. Test-System CPU: i7-12700KF RAM: 32 GB DDR4 NVMe KINGSTON SNV2S2000G OS: Ubuntu 24.04.4 Filesystem: ext4 with default settings (barrier=1, journaling enabled) Kernel: 6.8.0-31-generic About the new Competitor: Leaves Leaves is based on a persistent trie structure combined with copy-on-write storage and a concurrency model designed for parallel workloads. More details can be found in the Leaves documentation. Trie-based indexing O(k) lookup independent of dataset size; avoids comparator-based traversal. Copy-on-write and batching Persistent structure with batched updates to reduce write amplification. Memory-mapped storage Direct access via OS paging without a separate buffer manager. Confluence concurrency model Per-thread write isolation with asynchronous merging. Merkle-trie replication Replication uses a separate hash trie, enabling efficient synchronization without affecting normal operation. Efficient set operations Merge and intersection operate directly on the trie structure with structural sharing. Header-only implementation No separate build or linking step; easy embedding. Browser execution via WebAssembly Runs in the browser using IndexedDB as backend with the same data structure. Conclusion LMDB remains a strong baseline for embedded databases and a useful reference point for evaluating alternative designs. The results in this article show that a persistent-trie architecture consistently outperforms the conventional B-tree and LSM-based systems with only one exception.
Can Persistent Tries Beat LMDB? Leaves Database Benchmarked
Full Article
Original Source
Read the full article at Hackernoon →KhanList aggregates and links to publicly available news content. We do not host full articles from third-party sources. Always verify important information with original sources.