
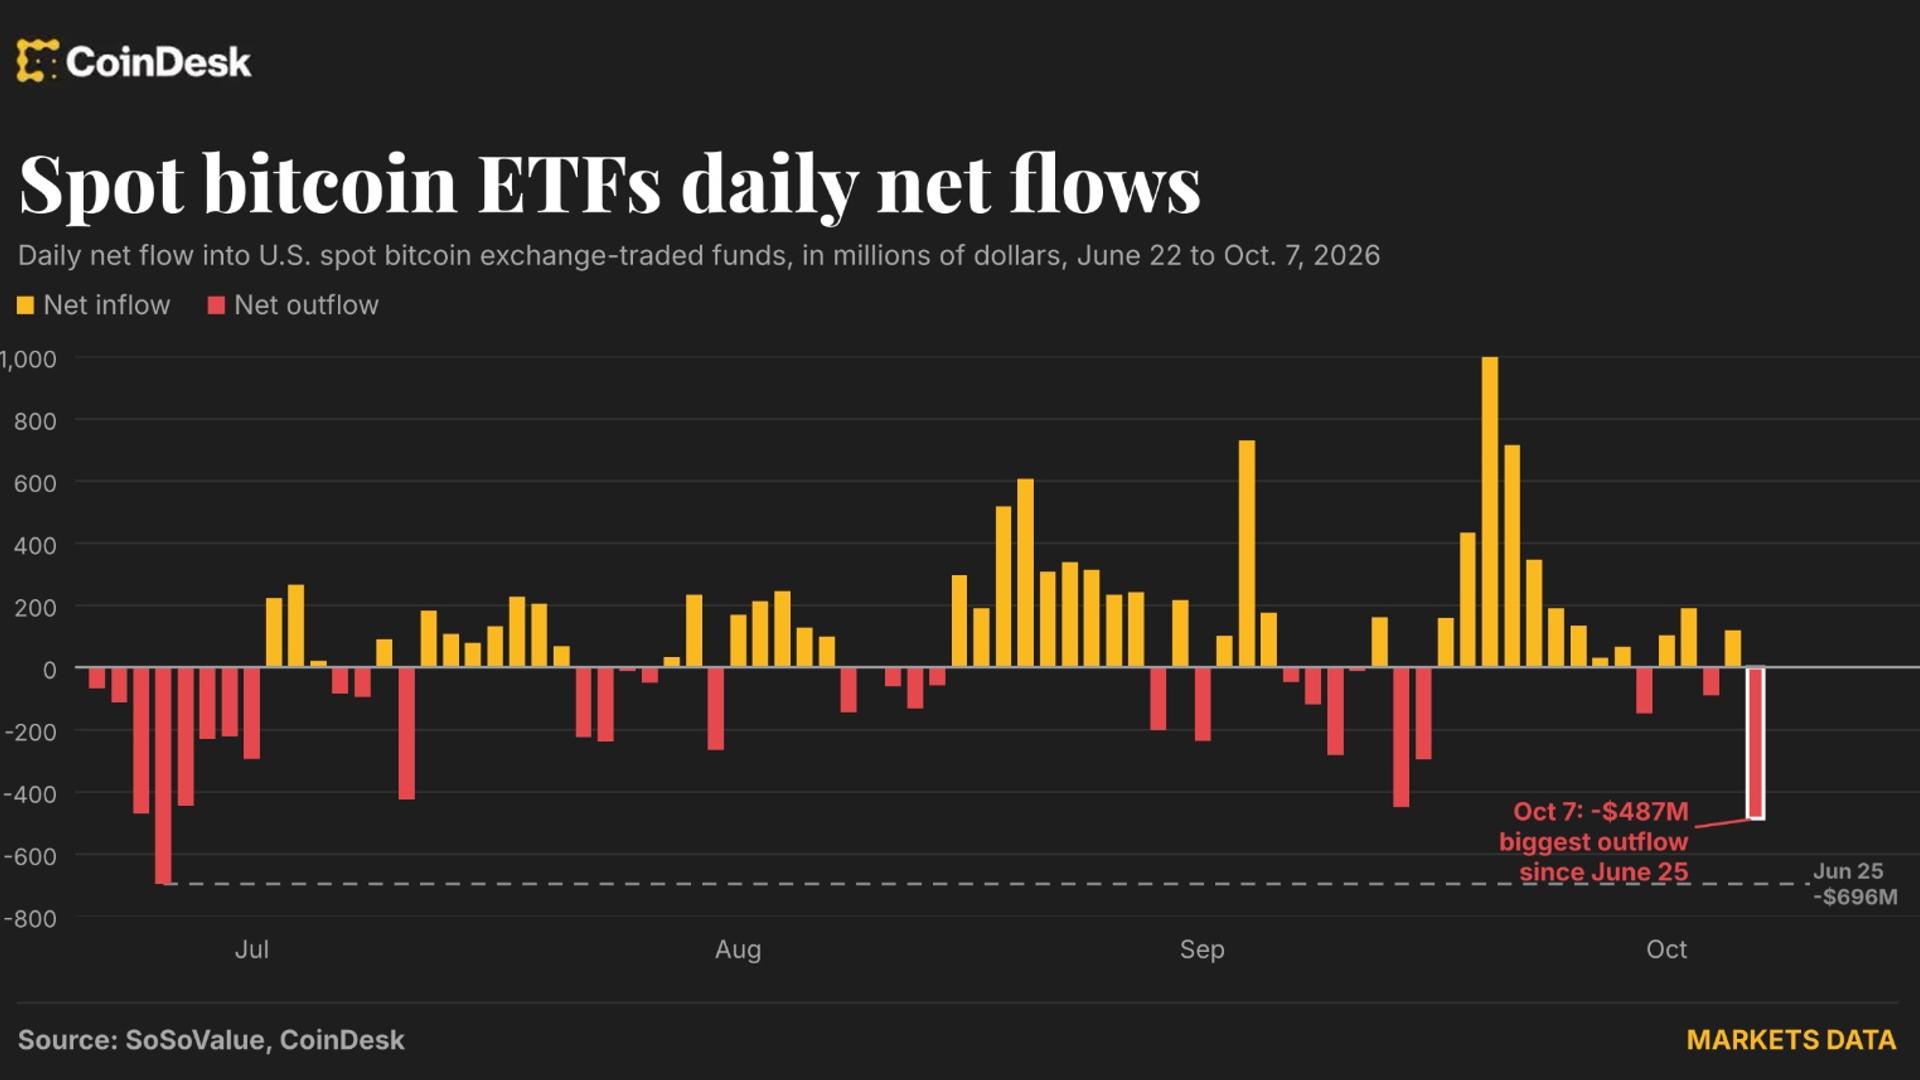
Bitcoin ETF investors head for the exit, and it's the biggest rush in monthsYour day-ahead look for Oct. 8, 2026Oct 8, 2026, 7:15 a.m. EDTETFs lost $487 million in outflows on Wednesday. (SoSoValue/CoinDesk)This is an excerpt from CoinDesk newsletter 'Daybook.' Sign up here, if you haven't already.Just 24 hours after analysts said big inflows into spot ETFs are required to lift bitcoin BTC$82,500.03 meaningfully above $87,000, a level that has limited gains lately, data shows sentiment went in the opposite direction. On Wednesday, the U.S. spot ETFs registered net outflows of $487.1 million, the most since June 25, according to data source SoSoValue.Flows have turned choppy recently. After about $2.65 billion of net inflows in September, October is down $165.6 million so far. The past six sessions have swung between small inflows and outflows.Wednesday's outflow was unusually large, some 2.1 standard deviations below the average daily flow of the past 90 days, which has been roughly $92 million in inflows, according to data analyzed by CoinDesk. In a normal distribution, roughly 95% of observations fall within two standard deviations of the mean. A larger move represents a rare or unusually large event. So far this year, the funds have taken in a net $717 million, which is only a thin cushion over zero, especially after the cumulative net flow bottomed at an outflow of $5.76 billion in July. Net inflow since the funds began trading in January 2024 stands at $57.33 billion.For now, bitcoin is trading around $83,000, flirting with the price floor that has held since the rally stalled on Sept. 21. Analysts have said that a sustained break lower would expose $80,000 and violate the steady bullish stair-step pattern on the daily chart."The $80.5K–$81.5K range encompasses last month's local highs and the 50-day moving average. It may not be difficult for the bears to push the price into this area. It is also worth keeping a close eye on whether this attracts bargain hunters or forces buyers with margin positions to capitulate,” Alex Kuptsikevich, chief market analyst at FxPro, said in an email.“In the former case, we can expect a rapid retest of the highs; in the latter, a sharp drop, like a high-speed lift, to $76K (recent lows) or $72K (the 200-day MA)," he added.Volatile Treasury notes remain a potential source of headwind, along with potential escalation of tensions between the U.S. and Iran and the resulting oil price spike. Amid all this, weakening spot ETF inflows, which were a major bid during the August-September rally, could prove costly. Stay alert!Read more: For analysis of today's activity in altcoins and derivatives, see Crypto Markets Today. For a comprehensive list of events this week, see CoinDesk's Crypto Week Ahead.What’s trendingBitcoin loans are paying for tuition and working capital, not just trades, lenders say (CoinDesk): Bitcoin-backed finance is maturing beyond trading and increasingly resembles traditional lending, being locked as collateral against borrowing used to fund real-world expenses.Bitcoin breaks below $83,000 as oil jumps on Iran strike-plan report (CoinDesk): Bitcoin fell to under $82,800 while oil jumped on a report that the White House asked the Pentagon for strike options against Iran, pushing Treasury yields back toward their highest since 2002.Dollar holds near 18-month high, euro lags as bond yields rise (Reuters): The dollar edged towards its strongest level in 18 months, after minutes from the Federal Reserve signaled policymakers viewed inflation as the biggest risk to their outlook, while higher oil prices and rising eurozone bond yields weighed on the euro.Oil rise spurs fresh selling in stocks and bonds: markets wrap (Bloomberg): A rise in oil prices prompted a fresh round of selling in bonds and stocks as even a record profit from chipmaking heavyweight Samsung Electronics Co. failed to muster demand for riskier assets.Today’s signalBTC's daily chart. (TradingView/CoinDesk)The chart shows bitcoin’s daily price swings in candlestick format since July. Overlaid is the average price over 50 days, represented by the yellow line. BTC is currently trading near the lower end of the recent consolidation pattern. A break lower would confirm a bearish resolution to the consolidation, potentially yielding a selloff to the 50-day average at $80,550. 12345678910
Bitcoin ETF investors head for the exit, and it's the biggest rush in months
Full Article
Original Source
Read the full article at Coindesk →KhanList aggregates and links to publicly available news content. We do not host full articles from third-party sources. Always verify important information with original sources.