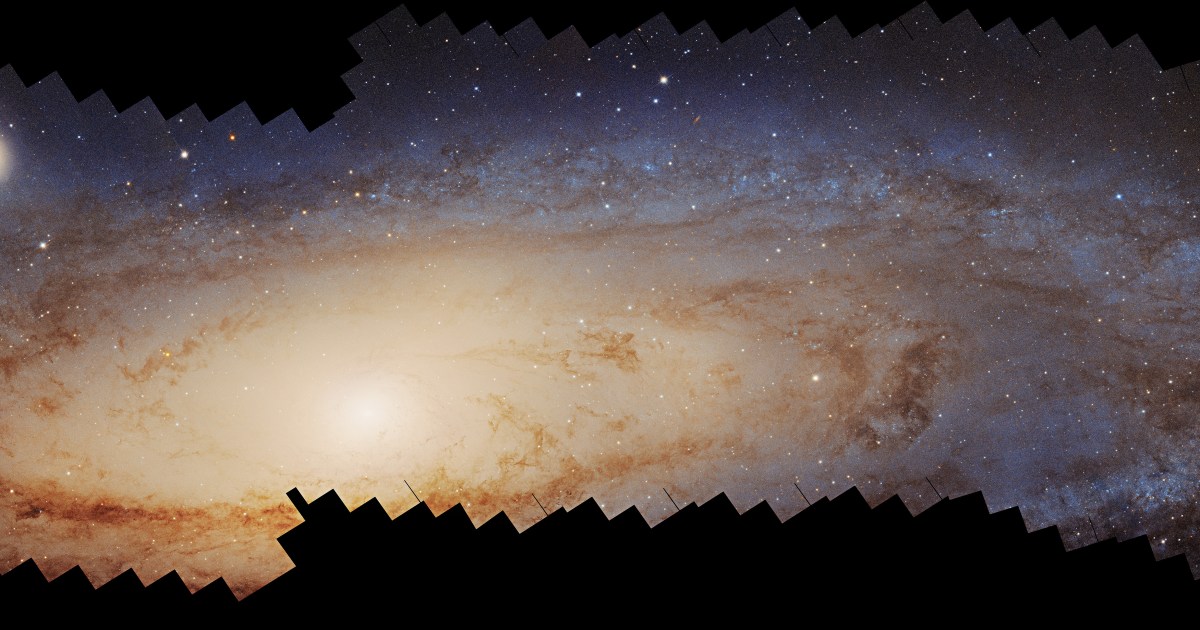
More than 600 Hubble Space Telescope exposures are stitched together in this panoramic mosaic of the Andromeda galaxy, resolving the glow of some 200 million individual stars across roughly 2.5 billion pixels. Credit: NASA, ESA, Benjamin F. Williams (UWashington), Zhuo Chen (UWashington), L. Clifton Johnson (Northwestern); Image Processing: Joseph DePasquale (STScI) Star formation in the nearby Andromeda Galaxy (M31) has been slowing down over the last 500 million years, according to a new study using Hubble Space Telescope data. The study was published July 27, 2026, in The Astrophysical Journal. Lead author Tobin Wainer, an astronomer at the University of Washington, and his team used data from two Hubble surveys to trace star formation across roughly two-thirds of Andromeda’s disk. Scientists already knew that Andromeda went through a star production boom some 2 billion years ago. The new study reveals that over the last half-billion years, that boom steadily slowed down. Then, in the last 40 million years, the rate decreased even more sharply. By tracing that history, astronomers hope to learn not only about Andromeda, but also about the past of galaxies like our own Milky Way. “This project is the combination of multiple decades worth of experience to really get a holistic picture of the Andromeda Galaxy,” Wainer said in an STScI press release. The perfect vantage point Andromeda sits about 2.5 million light-years away and is roughly the same size as the Milky Way. That combination of proximity and scale makes it unique. Andromeda is close enough that Hubble can pick out individual stars in detail, while still far enough away that astronomers can step back and see the whole disk at once. Because our own solar system sits inside the Milky Way’s disk, getting that same outside view is impossible. “Andromeda is important because it’s a neighbor that is close enough that we can see it in great detail while also getting a global perspective,” said Raja GuhaThakurta, study co-author and astronomer at University of California, Santa Cruz, in the press release. Tracking Andromeda’s decline Today, the Milky Way churns out stars at a rate of around 1 solar mass (the mass of our Sun) per year. Five hundred million years ago, Andromeda was forming stars at roughly that same speed — down from around 6 solar masses a year during the peak of its star production. By 40 million years ago, that rate had dwindled down to around half of a solar mass per year, and it has since dropped to around one-fifth of a solar mass per year. Most of that decline can be attributed to a ring of gas and dust that circles the galaxy about 32,000 light-years from its center. A 2015 study of the galaxy’s northern half found that this ring alone accounted for roughly 60 percent of all star formation in Andromeda over the last 400 million years. As the hyperactive ring’s activity faded, it dragged the galaxy’s overall rate down with it. Brighter colors mark where star formation rates were highest at each stage of this animation, built from an analysis of Hubble Space Telescope data spanning the last 500 million years of Andromeda’s star-forming history. Credit: Visualization: Tobin Wainer (UWashington); Image Processing: Joseph DePasquale (STScI); Video: NASA, ESA, STScI, Gregory Bacon (STScI) Who’s to blame? Andromeda is in close proximity to a handful of satellite galaxies, and the closest one is a small companion called M32. Some theories suggest M32 is the remains of a much larger galaxy that collided with Andromeda in the past, and that it may still be interacting with Andromeda’s disk today. “One of the major motivations for this program was to probe potential interactions between M32 and Andromeda’s disk,” said co-author Zhuo Chen of the University of Washington in the press release. The new data give that idea some traction. The region of Andromeda closest to M32 stayed on track with the rest of the galaxy’s star-formation rate for hundreds of millions of years, then started falling roughly 60 million years ago, eventually reaching a third below the average around 10 million to 15 million years ago. The fact that this region was forming stars at a below-average rate does hint at a possible interaction between the two galaxies. While the data provides some evidence of an interaction with Andromeda, scientists can’t say for sure. Astronomers can tell how far apart the two galaxies appear in two dimensions from our vantage point on Earth — about 16,000 light-years — but they don’t know precisely how far apart the two actually are in three dimensions of space, meaning they can’t currently confirm that the two are interacting. RELATED: Unveiling the Andromeda Galaxy’s true nature Another problem is that the leading theories for when M32 might have passed through Andromeda put it either around 200 million years ago or much more recently, 20 million years ago. While the new data are consistent with a possible merger interfering with star formation rates, the timing of the slowdown beginning around 60 million years ago doesn’t line up cleanly with the timeline of either of the leading theories. “We can’t explicitly say that we are seeing a decrease in star formation because of M32,” Wainer said. “But it’s right there, and it’s definitely the most likely suspect.” Mapping 200 million stars The study draws from two Hubble surveys: the Panchromatic Hubble Andromeda Treasury (PHAT), which covered the galaxy’s northern half, and its more recent counterpart, the Panchromatic Hubble Andromeda Southern Treasury (PHAST). Together they resolved about 200 million individual stars across roughly two-thirds of the galaxy’s disk. The team split those 200 million stars into a grid of squares, each about 300 light-years across, and studied them individually. The light from massive stars trends blue. They burn hot and fast and die off within a few million years. Smaller stars glow red and can stick around for billions of years. A square with more blue stars indicates an area that has been forming stars recently; a square with mostly red has not. The team plotted every square on what’s called a color-magnitude diagram, with a star’s color — running from blue to red — on one axis and its brightness on the other. By comparing those diagrams to models of stellar evolution, the team could infer each region’s star-formation rate over time. This method, known as color-magnitude diagram fitting, has previously been used to successfully map the star-formation histories of other nearby galaxies. Roman’s wider view While the researchers will continue supplementing this Hubble data with observations from Earth-bound telescopes, an even more comprehensive view of Andromeda is just around the corner. When NASA’s Nancy Grace Roman Space Telescope takes to the skies (slated for launch as early as Aug. 30), it will bring a massive upgrade in near-infrared imaging. Because Roman can capture an area roughly a hundred times larger than Hubble can in a single frame, astronomers are already preparing to photograph Andromeda’s complete disk in one sweeping observation. Brooks Mendenhall is a staff writer for Astronomy magazine and is based in Chattanooga, Tennessee.
Andromeda’s star formation is slowing down
Full Article
Original Source
Read the full article at Astronomy →KhanList aggregates and links to publicly available news content. We do not host full articles from third-party sources. Always verify important information with original sources.