
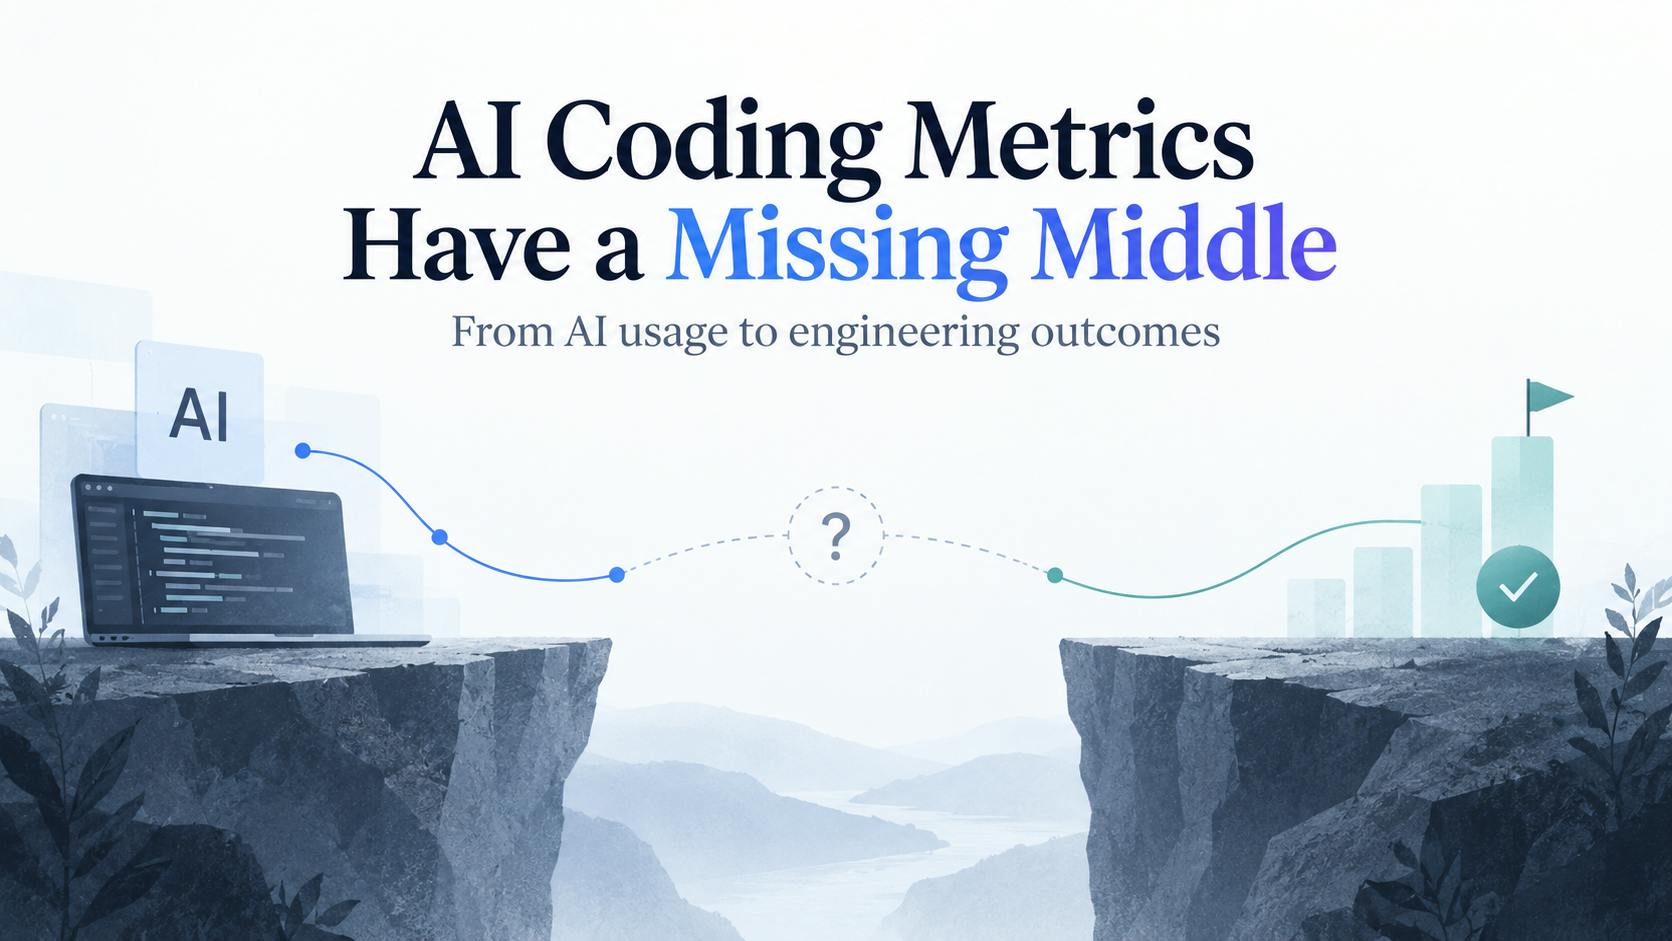
We can measure AI usage and software delivery. The hard part is understanding what happens between the two.AI coding measurement has become surprisingly sophisticated in a very short time. We can measure active AI users. We can see which tools developers use. We can count prompts, accepted suggestions, tokens, AI-assisted commits, and increasingly even identify which parts of a codebase were created with AI assistance.At the other end of the software delivery system, we already have mature engineering metrics:Pull request cycle timeReview timeDeployment frequencyChange failure rateReworkIncidentsDelivery lead timeYet there is a large gap between these two worlds.We know how much AI is being used.We know how software is being delivered.What we often don't know is what happened in between.That missing middle is where I think most of the interesting AI productivity questions now live.The First Generation of AI Metrics Was About AdoptionThis was reasonable. When companies started rolling out GitHub Copilot, Cursor, Claude Code, and similar tools, engineering leaders first needed answers to basic questions:Who has access?Who is actually using it?Which tools are being used?How many suggestions are accepted?How much does it cost?How much code appears to be AI-assisted?These are important operational metrics.But they answer a rollout question: Are developers using AI?They don't answer the much harder question: What changed in the engineering system because developers used AI?The distinction becomes more important as adoption increases. Once most developers in an organization use an AI coding tool, increasing adoption from 70% to 80% tells an engineering leader relatively little about whether the investment is working. At that point, usage stops being the interesting variable. The outcomes become interesting.Code Generation Is Only the Beginning of the PipelineSoftware doesn't become valuable when code is generated. It still has to survive:Coding → Review → Testing → Merge → Deployment → Production → MaintenanceThis sounds obvious, but many AI productivity dashboards effectively stop at the first step.Imagine an AI assistant reduces coding time by 30%.Great.Now imagine that the resulting pull requests are larger, review takes 25% longer, and rework increases.Did productivity improve?Maybe.Maybe not.It depends on where the time went.This is the first measurement principle I think engineering organizations need in the AI era:A local productivity gain is not necessarily a system productivity gain.Software engineering is a pipeline. Accelerating one stage can expose or create a bottleneck somewhere else.Think About AI as an Intervention in a Queueing SystemConsider a simplified engineering workflow:Work Item↓Coding↓Pull Request↓Review↓Testing↓Deployment↓ProductionSuppose AI dramatically increases the rate at which developers produce pull requests.The arrival rate into code review increases. But reviewer capacity hasn't changed. You can end up with something like this:MetricChangeCoding Time-25%PR Throughput+30%PR Pickup Time+18%Review Time+27%Looking only at coding activity makes AI look highly successful.Looking at the entire system tells a more complicated story.The bottleneck moved.This is not necessarily a failure of AI. In fact, it may mean the AI tool is doing exactly what it should.The organization simply hasn't adapted the rest of its engineering system to the new throughput.This Is Why "AI-Generated Code %" Is Both Useful and DangerousI actually think AI code attribution is becoming an important engineering signal. But not for the reason people sometimes assume.If 60% of a team's changes are AI-assisted, that does not mean the team is 60% more productive. It doesn't even mean those developers saved 60% of their coding time. What it gives us is something much more useful:An analytical dimension.Now we can ask:How do highly AI-assisted changes behave compared with less AI-assisted changes?For example:DimensionQuestionCodingAre AI-assisted changes completed faster?PR SizeAre AI-assisted PRs larger?ReviewDo they require more review time?ReworkHow much code changes again shortly after merge?QualityDo quality issues change?DeliveryDoes lead time improve?StabilityWhat happens to failed changes?AI contribution becomes useful when it is joined with engineering outcomes.By itself, it is just another activity metric.The Most Important Metric May Be Where the Work MovedOne of the mistakes we made with traditional developer productivity metrics was assuming visible activity corresponded closely to useful work: commits, lines of code, tickets closed, pull requests created.AI makes that assumption even more dangerous because producing artifacts is becoming dramatically cheaper. The question therefore changes from:How much did developers produce? to: Where did engineering effort move?This is closely related to a broader shift in software engineering measurement: activity metrics become far more useful when they are interpreted alongside flow, quality, delivery, and developer experience. I explored that broader measurement model in a separate guide to software engineering metrics, including why isolated activity counts can create misleading conclusions.An AI assistant might reduce:Boilerplate codingSearching documentationWriting initial testsCreating first implementationsRepetitive refactoring workAt the same time, it might increase:VerificationCode reviewDebuggingArchitectural checkingSecurity reviewReworkIf 40 minutes disappear from implementation but 25 minutes appear in verification, the productivity gain is not 40 minutes. And if that verification work falls on another developer, looking only at the original developer's metrics will completely miss it.We Need an AI Engineering FunnelInstead of a single AI productivity metric, I find it more useful to think of measurement as a funnel.1. ExposureWho can use AI?Examples:Licensed usersEligible developersAvailable AI tools2. AdoptionWho actually uses it?Examples:Active AI usersWeekly AI usageTool adoption by teamModel adoption3. ContributionWhere does AI participate in engineering work?Examples:AI-assisted changesAI-assisted commitsAI-heavy pull requestsAI-assisted development rate4. FlowWhat happens to development?Examples:Coding TimePR Cycle TimePR Pickup TimeReview TimeThroughputWork Item Cycle Time5. QualityWhat happens after that code is created?Examples:ReworkRevertsDefectsMaintainability issuesSecurity findingsTest failures6. DeliveryDoes the organization ship differently?Examples:Change Lead TimeDeployment FrequencyChange Fail RateRecovery TimeDeployment Rework7. OutcomeDid something economically meaningful change?Examples:Engineering capacityDelivery predictabilityCustomer outcomesEngineering costAI costTime to marketThe further down this funnel you go, the closer you get to actual organizational impact. The downside is that attribution becomes harder.That is unavoidable.AI Engineering FunnelThere Probably Isn't One "AI Productivity Number"Executives understandably like summary numbers. But I would be cautious about creating something like:AI Productivity Score: 83unless everyone understands exactly what went into it.AI affects multiple dimensions that can move in opposite directions. For example:MetricChangeCoding Time-21%PR Throughput+17%Review Time+14%Rework+9%Deployment Frequency+8%Change Fail Rate+3%Developer Satisfaction+16%Is AI working?That is a much more interesting engineering discussion than whether a score changed from 76 to 83.It also exposes something important:Productivity is multidimensional.A productivity improvement may appear as:Faster deliveryHigher qualityLess cognitive loadBetter developer experienceMore capacity for previously neglected workTrying to compress all of that into one number can destroy the information engineering leaders actually need.Controlled Experiments and Production Systems Tell Different StoriesThis is another reason the debate around AI productivity often becomes confusing.Some controlled experiments have shown large improvements in task completion speed when developers use AI coding assistants.Other real-world studies involving experienced developers working in mature repositories have found smaller gains, no gains, or even temporary slowdowns.Those results sound contradictory.They aren't necessarily.They measure different environments.A bounded programming task is different from changing a mature production system containing:Undocumented architectural decisionsHistorical tradeoffsDependenciesInternal conventionsOperational constraintsDomain knowledgeSecurity requirementsLegacy systemsThis makes universal statements like:"AI makes developers 30% faster"almost meaningless without context.The better question is:Which developers, performing which tasks, in which codebases, using which AI tools, measured at which part of the delivery system?Compare Cohorts Instead of Company-Wide AveragesSuppose an organization sees:AI adoption: 72%PR cycle time: -11%Deployment rate: +14%It is tempting to connect those numbers. But many things may have changed simultaneously.A better analysis starts segmenting.By RepositoryAI may be extremely effective in one codebase and much less useful in another.By Type of WorkFeature development, maintenance, testing, refactoring, and incident fixes are different activities.By TeamDifferent engineering practices can dramatically change AI outcomes.By AI ContributionCompare lower and higher AI-assisted work.By PR SizeOtherwise, AI-heavy work may simply be larger or smaller.By TimeCompare stable periods rather than only the week immediately before and after rollout.The goal isn't to manufacture causality.The goal is to eliminate obviously misleading comparisons.Correlation Is Still UsefulEngineering analytics sometimes falls into another extreme.If we cannot prove causality perfectly, some people conclude we shouldn't measure the relationship at all.I disagree.Observational engineering data can still reveal useful patterns.Suppose high-AI pull requests repeatedly show:Coding Time ↓PR Size ↑Review Time ↑Rework ↑That doesn't prove AI caused the pattern. But it gives an engineering leader a very useful hypothesis:Maybe our AI-enabled development workflow needs smaller pull requests or stronger automated validation.You can now change the system and observe what happens.Measurement becomes an improvement loop rather than a performance judgment.That's much more useful.Measure AI at the Team Level Before the Individual LevelAI telemetry makes extremely granular measurement possible. That doesn't mean every possible metric should become a management metric.I would be especially cautious about metrics such as:AI-generated lines per developerPrompt count per developerCommits per developerAcceptance-rate rankingsAI productivity leaderboardsOnce people realize a metric affects how they are evaluated, the metric stops behaving like neutral telemetry.It becomes a target. And targets get optimized.Instead, start with teams and workflows.Ask:Is this team's engineering system improving?Then use deeper data diagnostically when the team needs to understand why.The objective should be improving the engineering system, not building a more sophisticated surveillance system.Every Speed Metric Needs a Counter-MetricThis is perhaps the simplest practical rule. Whenever AI appears to improve one metric, place a balancing metric beside it.If you measure...Also measure...Coding TimeReworkPR ThroughputReview TimePR SizeReview LoadDeployment FrequencyChange Fail RateAI ContributionQualityCycle TimeDeveloper ExperienceAI CostDelivery OutcomeWhy?Because optimization in engineering frequently transfers cost.A team can increase deployment frequency by making smaller deployments.Good.Or by bypassing necessary controls.Not good.The number alone can't tell you which happened.What I Would Put on an AI Engineering DashboardNot 40 AI metrics. I'd start with something much smaller.Adoption:Active AI DevelopersAre people actually using the tools?Contribution:AI-Assisted Development RateWhere is AI participating in actual engineering work?Flow:PR Cycle TimeIs work moving through development faster?Review:Review TimeDid the bottleneck move downstream?Quality:Rework RateAre we creating additional follow-up work?Delivery:Change Lead TimeIs local acceleration reaching production?Stability:Change Fail Rate / Deployment ReworkAre faster changes remaining reliable?Experience:Developer PerceptionDo developers actually feel that the workflow improved?Economics:AI CostWhat are we paying to create those changes?That's already enough to have a substantially better conversation.The Question Has ChangedA few years ago, the interesting question was:Can AI write useful production code?Then it became:Will developers adopt AI coding assistants?Both questions are becoming less interesting.The next question is harder:What happens to a software engineering system when AI becomes a normal participant in development?An AI tool's usage dashboard can't answer that question. And it cannot be answered by traditional engineering metrics alone.You need both.AI attribution without engineering outcomes tells you what AI did. Engineering outcomes without AI context tell you what changed. Connecting the two is where we begin to understand impact. And that missing middle may turn out to be the most important part of measuring software engineering in the AI era.
AI Coding Metrics Have a Missing Middle
Full Article
Original Source
Read the full article at Hackernoon →KhanList aggregates and links to publicly available news content. We do not host full articles from third-party sources. Always verify important information with original sources.