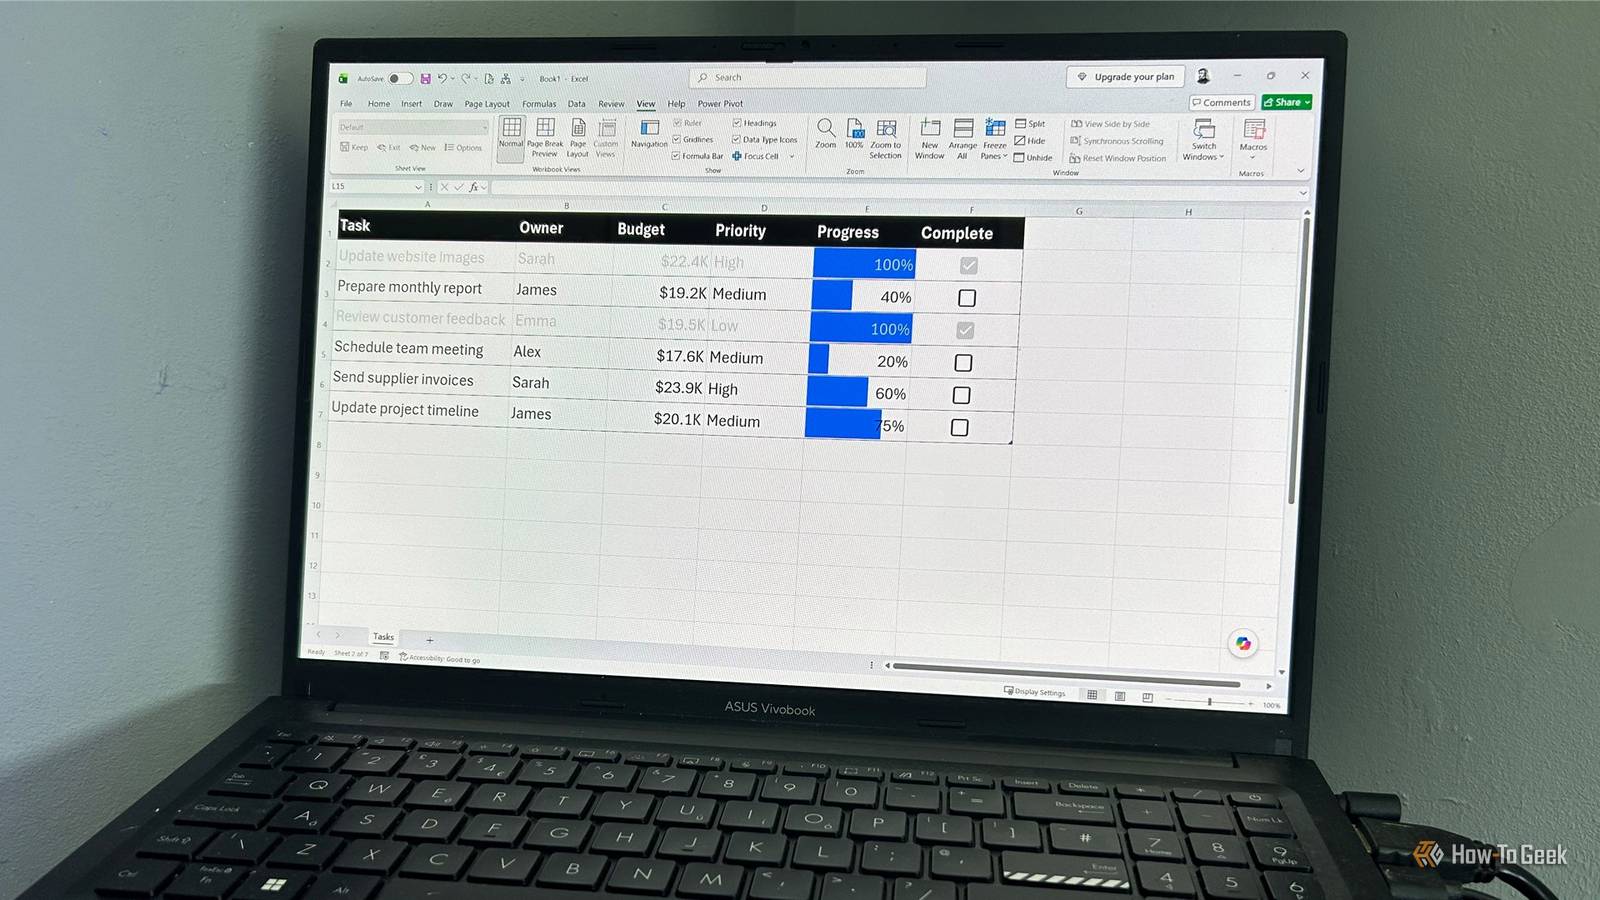
Published Aug 12, 2026, 10:30 AM EDT Tony Phillips is an experienced Microsoft Office user with a dual-honors degree in Linguistics and Hispanic Studies. Prior to starting with How-to Geek in January 2024, he worked as a document producer, data manager, and content creator for over ten years, and loves making spreadsheets and documents in his spare time. Tony is also an academic proofreader, experienced in reading, editing, and formatting over 3 million words of personal statements, resumes, reference letters, research proposals, and dissertations. Before joining How-To Geek, Tony formatted and wrote documents for legal firms, including contracts, Wills, and Powers of Attorney. Tony is obsessed with Microsoft Office! He will find any reason to create a spreadsheet, exploring ways to add complex formulas and discover new ways to make data tick. He also takes pride in producing Word documents that look the part. He has worked as a data manager in a secondary school in the UK and has years of experience in the classroom with Microsoft PowerPoint. He loves to encounter problems in Microsoft Office and use his expertise and legal-level training to find solutions. Outside of the Microsoft world, Tony is a keen dog owner and lover, football fan, astrophotographer, gardener, and golfer. If you've ever searched for ways to make your Excel spreadsheets look better, you've probably been told to avoid Comic Sans MS, stop using thick borders, and choose better cell colors. But that advice is mostly geared toward appearance rather than usability. I get much better results by using Excel's built-in formatting tools to make data easier to read, compare, and understand. Cell styles replace repetitive manual formatting Create once, reuse forever I used to format cells manually. Headings, input cells, and calculation areas all needed their own formatting, so I jumped back and forth between the grid and the Font group of the Home tab. This worked, but it meant formatting was inconsistent, and every workbook slowly developed its own look. Cell Styles solve this problem by letting you visually define what a cell represents. Instead of deciding that a cell should be bold, yellow, or use a particular font size, you assign it a purpose: an input cell looks like an input, a calculation cell looks like a calculation, and an output cell looks like an output. Excel has several built-in options, but the real value comes from creating styles that match how you work and reusing them throughout your workbooks. After formatting a cell exactly how I want it to appear, I go to Home > Cell Styles > New Cell Style, then choose which formatting elements I want the style to control. Just remember that the original cell is still manually formatted, so make sure you include it in your selection when applying the new style. If you create a useful Cell Style in one workbook and want to use it elsewhere, go to Home > Cell Styles > Merge Styles, choose the workbook containing the style, and Excel will copy it across. Conditional formatting explains data at a glance Let Excel find what matters Many Excel spreadsheets are difficult to read for a simple reason: everything looks the same. When rows of numbers, dates, and statuses all have identical formatting, you have to manually search for the info that matters. Conditional formatting makes formatting respond to the data itself. Instead of manually highlighting cells every time the underlying data changes, you can create rules that Excel applies automatically. Most of the time, I use the preset options (Home > Conditional Formatting), like Data Bars, Icon Sets, and Color Scales, as they only take a few seconds to set up. For more complex scenarios where I need to create rules around more specific logic, such as applying a gray font when a checkbox is checked, I use formula-based conditional formatting (Home > Conditional Formatting > New Rule > Use a formula to determine which cells to format). One thing to watch: don't treat conditional formatting as a decoration. A spreadsheet filled with colors and icons can end up being harder to understand, not easier. The best formatting rules don't distract from the data itself. Built-in number formats keep your data consistent Small changes, cleaner results When people talk about making spreadsheets look "better," they usually focus on fonts, colors, and layouts. However, inconsistent number formats can make even a good-looking worksheet feel unfinished. A column of percentages displayed as decimals, financial values without currency symbols, or long ID numbers shown as scientific notation all make info harder to read. The underlying values might be right, but the way they're presented affects how easy they are to understand. I rely on Excel's built-in number formats to fix these issues quickly. Select the relevant column, open the Home tab, and look in the Number group. The quickest options are these three buttons on the ribbon: Accounting is ideal for financial reports where the currency symbols and decimal places need to align, the Percent Style turns decimals like 0.25 into percentages like 25%, and the Comma Style is a great way to make large numbers more readable. For more options, expand the drop-down menu in the same group. Text is useful for displaying values exactly as entered (like reference numbers, ZIP codes, or product codes), while Date formats help you display dates clearly when working with time-based calculations. Custom formats go beyond the basics Add context without changing values Over the years, I've seen coworkers manually edit cells to make reports easier to read. They might replace zeros with dashes, add "items" after numbers, or shorten large values by typing "K" or "M" directly into cells. The intention is good: the spreadsheet becomes cleaner and much easier to scan. But the problem is that these changes also alter the data itself, so calculations, sorting, and other Excel tools don't work as expected. Custom number formats (Ctrl+1 > Number > Custom) solve this by changing how a value appears without changing the underlying value. Here are three examples I use all the time. Make thousands and millions easier to scan A report containing values like 125,000 or 1,250,000 can quickly become hard to read. To display thousands, type this into the Type field: #,##0.0,"K";-#,##0.0,"K" For millions, use: #,##0.0,,"M";-#,##0.0,,"M" The first trailing comma divides the displayed value by 1,000, and the second divides it by 1,000,000. The .0 keeps one decimal place, so 1,250,000 displays as 1.3M rather than 1M. Replace zeros with dashes Zeros can be useful, but they sometimes add visual noise to reports where a dash might communicate the same info more cleanly. In this custom format, positive numbers display normally, negatives adopt parentheses, and dashes replace zeros: #,##0;(#,##0);- Remember, the zero value is still stored in the cell, so any formulas referencing it will carry on working as expected. Add units If you prefer units to be displayed inside cells rather than in column headers, you can add them through the number format. For example, to display "items" after a value, enter: 0 "items" Another example could be temperatures: 0 "°F" Banded rows aren't always the best choice Simplify your tables Excel tables make it easy to add structure to a worksheet, and the default banded rows style is popular because the alternating shading helps you track across wide datasets. However, if a table already contains conditional formatting, status indicators, or other visual cues, banding can make it feel busier than it needs to be. When I format my data as a table, I often head to the contextual Table Design tab and uncheck Banded Rows in the Table Style Options group or choose a non-banded style in the Table Styles group. If you use Excel for Microsoft 365 on Windows or Mac, or Excel for the web, you can enable Focus Cell, which highlights the column and row of the active cell. This means you can still follow the active row and column without adding permanent shading to the worksheet. Microsoft 365 Personal OS Windows, macOS, iPhone, iPad, Android Free trial 1 month Microsoft 365 includes access to Office apps like Word, Excel, and PowerPoint on up to five devices, 1 TB of OneDrive storage, and more. Moving beyond spreadsheet decoration Choosing a "nice" font or adding a few colors will only take your spreadsheets so far. Well-designed workbooks come from using formatting intentionally and applying it consistently. Small workflow improvements like Format Painter, F4, and Find and Replace help turn those choices into repeatable habits instead of one-off fixes.
5 Excel formatting tools I use in every spreadsheet I create
Full Article
Original Source
Read the full article at Howtogeek →KhanList aggregates and links to publicly available news content. We do not host full articles from third-party sources. Always verify important information with original sources.