
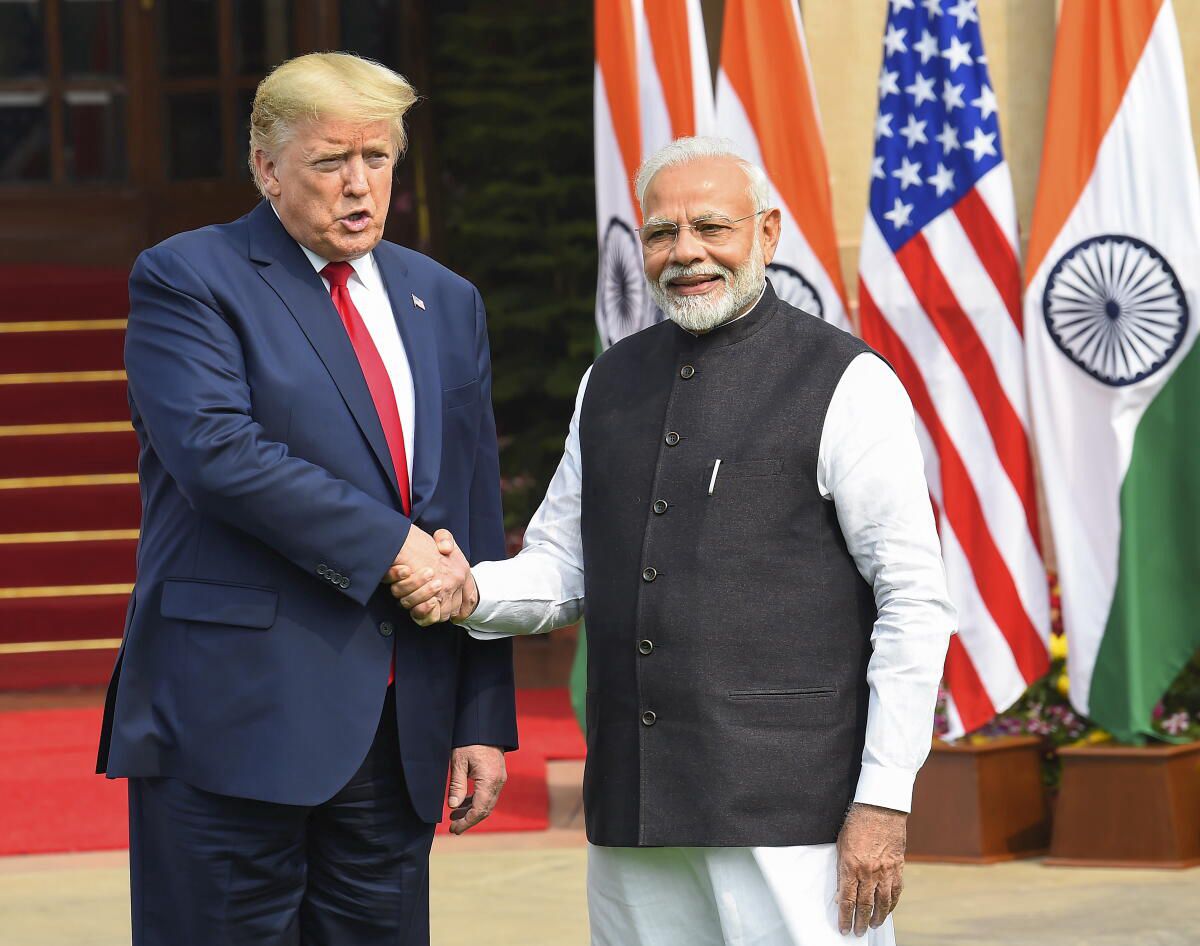
Published September 21, 2026 Prime Minister Narendra Modi with U.S. President Donald Trump in New Delhi on Feb. 25, 2020. (PTI Photo) As the Trump administration has repeatedly changed tariffs on Indian goods, New Delhi has been signing trade agreements at a rapid pace. But can these new markets meaningfully reduce India’s dependence on the U.S. as it’s faced with 100% tariffs? How U.S. tariffs on Indian goods have changed since 2025 Tariff rate0%10%25%50%Feb 2025May 2025Aug 2025Nov 2025Feb 2026May 2026Aug 2026Proposed“Reciprocal” tariffs announced26% under IEEPA50% after Russian-oil penaltyU.S. Supreme Court strikes down IEEPASection 301 finalised at 10% The U.S. House of Representatives has passed legislation giving U.S. President Donald Trump broad powers to impose sanctions on Russia and tariffs of up to 100% on countries that buy Russian oil and gas, a measure that could once again put Indian exports in the firing line. The development comes after more than a year of upheaval in India-U.S. trade. Since Trump returned to the White House, Indian exporters have faced repeated changes in tariff rates, the products covered and the laws used to impose them. The uncertainty matters because the U.S. has only become more important to India’s exporters. This bill comes amidst New Delhi and Washington negotiating a preliminary trade deal. The Trump administration had announced an additional 25% tariff, on top of an existing 25% tariff on India in July 2025, for the purchase of Russian oil. The share of Russian crude oil in Indian oil imports fell to its lowest level in two years in December 2025, but energy markets have been under additional pressure owing to the U.S.-Iran conflict and New Delhi’s import of Russian oil hit an 11-month high in April this year. However, the U.S. Treasury paused sanctions for oil shipments that were in transit before March 11, as supplies were hit following the start of the conflict in West Asia on February 28. Russia accounted for more than 51% of India’s oil imports in July, an all-time high, up from just a little less than 50% in the previous month, the latest official data shows. An analysis of Commerce and Industry Ministry data shows India imported 110.4 lakh tonnes of Russia oil in July, the latest month for which data is available. U.S. is India’s most important trading partner, as evident in its imports from India. In 2025, the U.S. bought about $92 billion worth of Indian merchandise, almost four times the $24 billion it bought in 2010. Its share of India’s merchandise exports nearly doubled over the period. Even as the Trump administration has repeatedly turned to tariffs, New Delhi has been rapidly expanding its network of trade agreements, opening up markets across Europe, West Asia and elsewhere. But can these new markets meaningfully reduce India’s dependence on the U.S.? How the U.S. tariff regime has been changing India is not alone in facing U.S. tariffs. On April 2, 2025, the Trump administration announced a 10% additional tariff on imports from almost all trading partners, along with higher country-specific rates for dozens of economies. India was assigned a 26% rate, while other major trading partners including the European Union, Japan and South Korea were also placed above the 10% baseline. The higher country-specific tariffs were suspended days later for most countries, leaving the 10% baseline in place. China was treated separately and faced substantially higher rates during the ensuing tariff dispute. U.S. Section 301 tariffs, as of July 2026 Tariff rates vary by country. For some, the rate is an additional duty on top of existing tariffs, while for others it is a total rate that includes existing duties. 10% + existing tariff(additional duty)12.5% + existing tariff(additional duty)10% total(includes existing duties)12.5% total(includes existing duties)Not covered by this action Loading tariff map… In July 2025, the U.S. announced a 25% rate for India, which it then hiked to 50% as a penalty for importing Russian oil. The additional Russian-oil tariff was removed in February 2026, when India and the U.S. announced a framework for an interim trade agreement. The tariff regime changed again in 2026. After the U.S. Supreme Court struck down the use of emergency economic powers for the reciprocal tariffs, the administration turned to other provisions of U.S. trade law. A temporary 10% import surcharge under Section 122 took effect on February 24 and remained in force until July 24. In July, the U.S. Trade Representative imposed new Section 301 tariffs on 60 economies following an investigation into forced-labour import restrictions. The rates varied by country, from 10% for India, the UK and several others to 12.5% for many of the economies covered. Since July, around 55% of India’s exports to the U.S. have faced this additional 10% Section 301 duty. The remaining 45% are outside its scope, including generic pharmaceuticals, smartphones and products already subject to separate Section 232 tariffs such as steel, aluminium and auto parts. These repeated changes have made it difficult for exporters to plan around fluctuations in the U.S. market, said Biswajit Dhar, an economist and former professor at Jawaharlal Nehru University. “With regular changes in U.S. tariff rates, Indian exporters face serious uncertainties over their expected earnings in the world’s largest economy,” he said. Indian Liquified Petroleum Gas carrier Shivalik as it arrives at the Mundra Port in Gujarat, India. (REUTERS/Amith Dave) Meanwhile, India’s dependence on the U.S. has grown Over the years, the U.S. has accounted for a growing share of India’s exports. What Indian exporters sell to American buyers has also changed. Two decades ago, consumer goods made up more than half of India’s exports to the U.S., while capital goods accounted for just 11.4%. By 2025, the share of consumer goods had fallen to 40.9%, while capital goods had risen to 28.6%. The composition within those broad categories has changed too. In 2005, precious stones accounted for 24.7% of India’s exports to the U.S. and textiles and apparel for 21.3%. By 2025, their shares had fallen to 7.3% and 8.3%, respectively. Source: International Trade Center trade map. Shares are each product group’s value divided by total merchandise exports to the U.S. that year. Electrical machinery moved in the opposite direction. It accounted for just 2.6% of India’s exports to the U.S. in 2005, but by 2025 had become the largest category, making up 28% of the export basket. Pharmaceuticals also increased from 1.6% to 10.4% over the period. Some of these industries are also highly dependent on the U.S. as a destination. In 2025, 48.1% of all electrical machinery exported by India went to the U.S. The corresponding share was 55% for carpets and 37.3% for pharmaceuticals. For some smaller categories, the dependence was even greater. The U.S. accounted for 77.3% of prepared meat and fish exports in 2025. This makes changes in U.S. market access particularly important for Indian exporters. For several industries, the U.S. accounts for a substantial share of their total overseas sales. Union Minister of Electronics and Information Technology Ashwini Vaishnaw during the inauguration of a manufacturing unit for tempered glass used in mobile phones, in Noida, Uttar Pradesh, on Aug. 30, 2025. (PTI Photo) India’s attempt at diversifying its trade partnerships India has also accelerated its push for new trade agreements. Since 2021, India has concluded or announced nine trade agreements covering 38 countries. The Comprehensive Economic Partnership Agreement with the UAE came into force in 2022, followed by the Economic Cooperation and Trade Agreement with Australia later that year. India signed an agreement with the four-country European Free Trade Association in 2024. Deals with the UK and Oman followed, while India has also concluded negotiations with the European Union and signed an agreement with New Zealand. These agreements offer Indian exporters significant tariff concessions. Under the agreement with the UK, for instance, nearly 99% of Indian exports will receive zero-duty access. Oman has offered duty-free access covering more than 99% of Indian exports by value. New Zealand has agreed to eliminate tariffs across all tariff lines once the agreement comes into force. Source: Trade Intelligence Analytics TIA Portal, Department of Commerce From January 2026, Indian goods also received zero-duty access across all Australian tariff lines. The agreement concluded with the EU is potentially the most significant because the size of the European market comes closest to that of the U.S. The concessions negotiated cover more than 99% of Indian exports by trade value, although the agreement is not yet in force. Even as FTAs have expanded India’s access, the scale of these markets matters. India’s bilateral trade with the UAE rose from about $43 billion in FY2021 to around $100 billion in FY2025. Trade with Australia increased from roughly $12 billion to $24 billion over the same period. This growth cannot be attributed entirely to trade agreements. Commodity prices, domestic demand, exchange rates and wider economic conditions also affect bilateral trade. An FTA also does not automatically redirect exports from one country to another. Exporters still have to find new buyers and distribution networks. Products may also need to meet different regulatory and technical standards. In some markets, non-tariff barriers may matter more than the tariff itself. Trade with India’s FTA partners has grown Pre-FTA reference level (FY2021) FY2025 trade $0B$25B$50B$75B$100BBilateral trade with India ($ billion)UAECEPA$43.3B$100.0BEFTATEPA$20.5B$24.4BAustraliaECTA$12.3B$24.1BUKCETA$13.1B$23.1BOmanCEPA$5.40B$10.6BNew ZealandFTA$0.87B$1.30BMauritiusCECPA$0.79B$0.89B Note: The chart compares trade before and after the FTA period. It does not imply that the FTA caused the increase. Source: Ministry of Commerce and Industry database The EU illustrates both the opportunity and the limitation. It is the only market large enough to approach the U.S. as an export destination for India, even as the U.S. remains the largest single destination among the markets considered. India’s exports to the European bloc increased from about $49.5 billion in 2017 to $78.5 billion in 2025. The EU accounted for about 17.6% of India’s merchandise exports in 2025. Together, the U.S. and EU accounted for roughly 38% of India’s merchandise exports that year. The recently concluded trade agreement could substantially improve tariff access for Indian products. But greater access does not guarantee that industries heavily dependent on American demand will begin selling comparable quantities in Europe in the short term. The same problem is more pronounced for smaller FTA partners. The UK is considerably smaller. India’s exports to the country increased from about $9 billion in 2017 to $13.8 billion in 2025. Australia also became more important, with exports rising from about $3.9 billion to $7.7 billion. But it still accounted for only about 1.7% of India’s merchandise exports in 2025. The UAE, UK and Australia can provide additional demand. But individually they remain far smaller destinations for Indian merchandise than the U.S. Diversifying away from the U.S. would be difficult in the short term, Dhar said. The U.S. is the largest market for some of India’s most export-oriented industries, particularly mobile phones and pharmaceuticals. Entering new markets would also take time and investment, especially for pharmaceutical companies that need to establish their products and build demand, he said. For sectors with high exposure to the U.S. market, it remains to be seen whether greater market access through FTAs translates into more exports to these destinations. Dhar pointed to China’s experience. Before Donald Trump began targeting China during his first term, a much larger share of its exports went to the U.S. “China saw the writing on the wall and began developing new markets for its exports,” Dhar said. By the time Trump returned to the White House, that share had fallen substantially. “If India can garner stronger political will, it could reduce its export dependence on the U.S. in a shorter time span than China did.” Data do not yet show India moving away from the American market. The U.S. share of Indian exports has risen steadily, reaching more than one-fifth in 2025. And the possibility of another major tariff shock has now moved closer. The U.S. House of Representatives on Wednesday passed legislation giving Trump broad powers to impose sanctions on Russia and tariffs of up to 100% on countries that buy Russian oil and gas. India, one of the largest buyers of Russian crude since the invasion of Ukraine, could be affected by the measure. The legislation will now go to Trump to be signed into law. It does not mean a 100% tariff on Indian goods automatically takes effect. Rather, it gives the President authority to impose tariffs of up to that level on countries purchasing Russian energy. For Indian exporters, the development adds another source of uncertainty around the market that has become their most important overseas destination. India’s new trade agreements provide access to a much wider set of markets. Whether those markets can reduce that dependence will ultimately depend on whether Indian exports actually begin shifting towards them.
100% U.S. tariff threat: Can India’s new trade deals reduce its dependence on America?
Full Article
Original Source
Read the full article at Thehindu →KhanList aggregates and links to publicly available news content. We do not host full articles from third-party sources. Always verify important information with original sources.